How to Read It, Set It Up, and Trade It · When it's green, you go.
This course teaches you how to use the Green Light Special (GLS) and its companion GLS OSOB the right way. By the end you'll know how to read every part of the dashboard, dial in the best settings, take a trade step-by-step, manage it, and — just as important — know when to stand aside. Read it once front-to-back, then keep it open beside your charts for your first week.
🟡
Important honesty up front: GLS is a decision tool, not a money machine. No indicator predicts the market or guarantees profit. The edge is filtering, risk/reward, and discipline — this course teaches you to use all three.
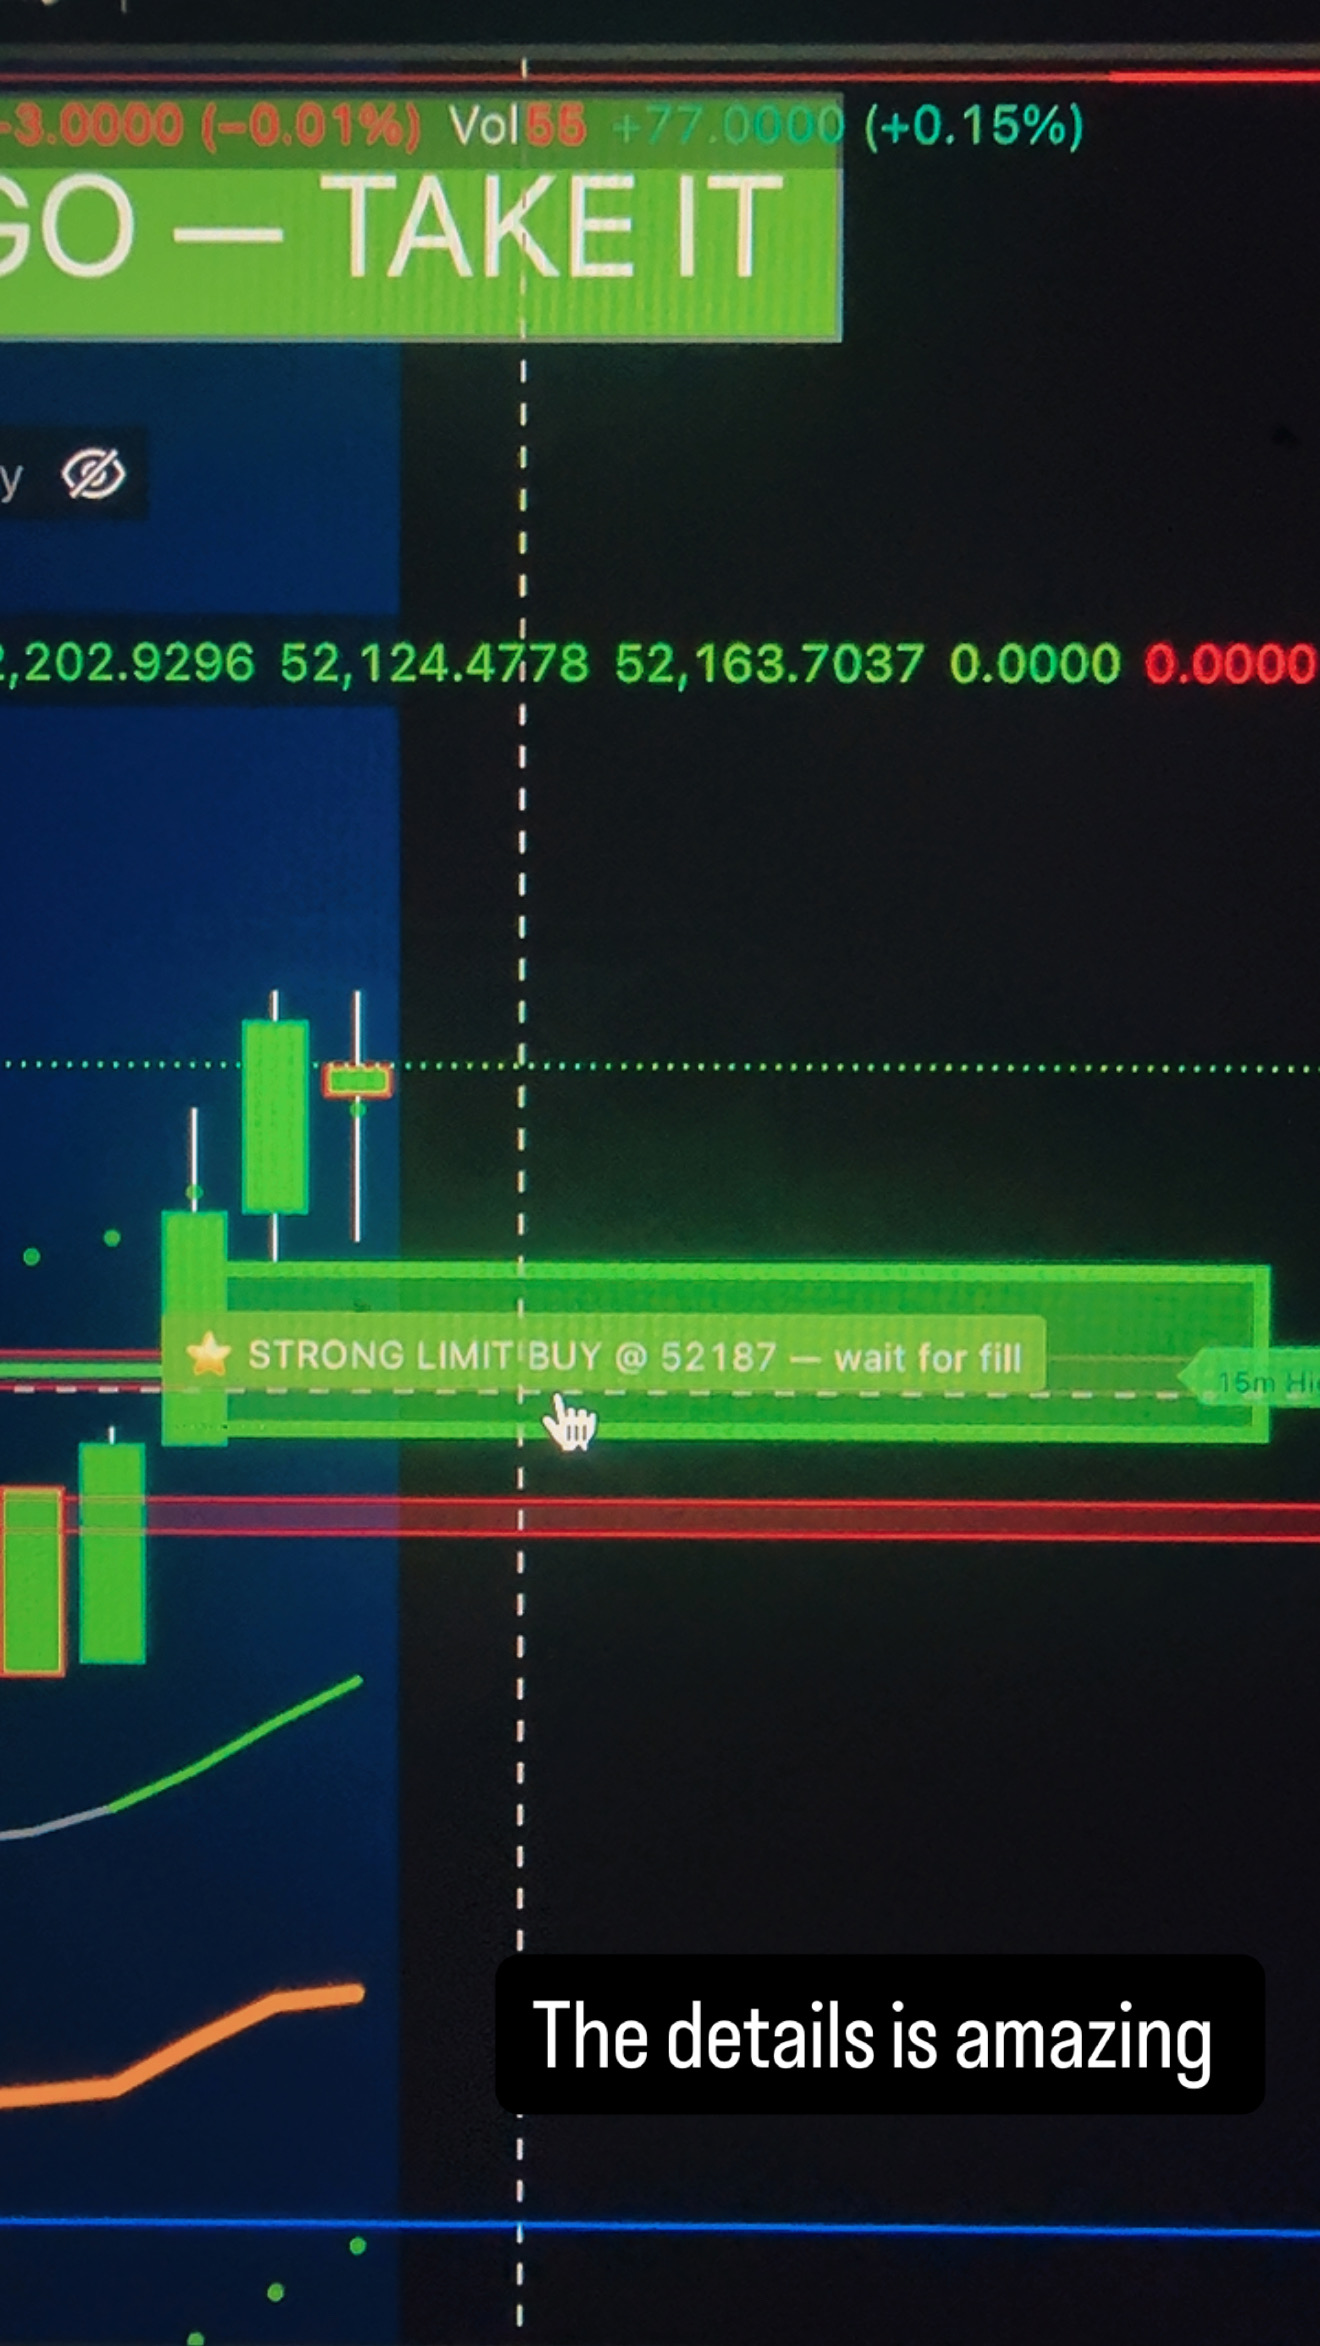
GLS in action — the banner calls "GO — TAKE IT" and the limit waits for the fill
01
What You Get
Your access includes two indicators, used together:
Green Light Special — the main chart indicator. It reads direction across four timeframes, filters out the chop, and shows you when to enter, where your stop and target go, and how big to size.
GLS OSOB — a companion pane that sits below price. Its one job: tell you when to get out / take profit.
🟢
In + OutGLS tells you when to get in. OSOB tells you when to get out. Run both.
Built for: intraday index & commodity futures — MES · MNQ · MGC · MYM (and similar index/commodity contracts).
Best timeframes: the 5-minute and 15-minute.
02
Quick Start (5 minutes)
Open TradingView → Indicators → Invite-Only Scripts.
Add Green Light Special and Green Light Special — OSOB to your chart.
GLS goes on the main price chart. OSOB drops into its own pane below automatically.
Set your chart to MES / MNQ / MGC / MYM on the 5m (day trading) or 15m (more context).
One-time scale fix (only if needed): if the lines ever look like they're floating off the candles, right-click the price axis → "Merge all scales into one." (The latest version locks to the candles automatically, so most people never touch this.)
That's it — you're ready to read the dashboard.
03
Best Settings
GLS ships ready to trade. These are the recommended defaults and the few you may tune.
🟢 Leave these ON — the core
🎯 Sniper BUY/SELL — the proven opening-momentum entry
Daily trend lock — only trade with the daily trend
Require above-average volume
Chop filter
🚀 Opening-Range Breakout
⭐ A+ Setup (golden pocket)
📊 VWAP line
🛡 Firewall — daily loss limit + profit goal
Recommended values
Chop filter:0.3 — lower = more signals (more chop), higher = stricter (fewer, cleaner). Start at 0.3.
Volume × average:1.2 — only takes breaks with above-average volume.
Sniper band width (× ATR):1.0 — lower = more signals, higher = only the biggest breaks.
Max risk per trade ($): set to your number (e.g., $100–$250). GLS auto-sizes to it.
Reward multiple (R):2.0–3.0.
Daily loss limit / profit goal: set to your account's rules (funded accounts: match your drawdown).
Off by default (turn on only if you want them)
🛡🧱 Strong S/R levels (master switch — flip ON to show support/resistance)
💧 Liquidity lines (PDH/PDL), 🏛 BOS/CHoCH, Power Hour, Highlight-all-gaps
✅
RuleStart with defaults. Only change one setting at a time so you understand its effect.
04
The Dashboard (read this first, every time)
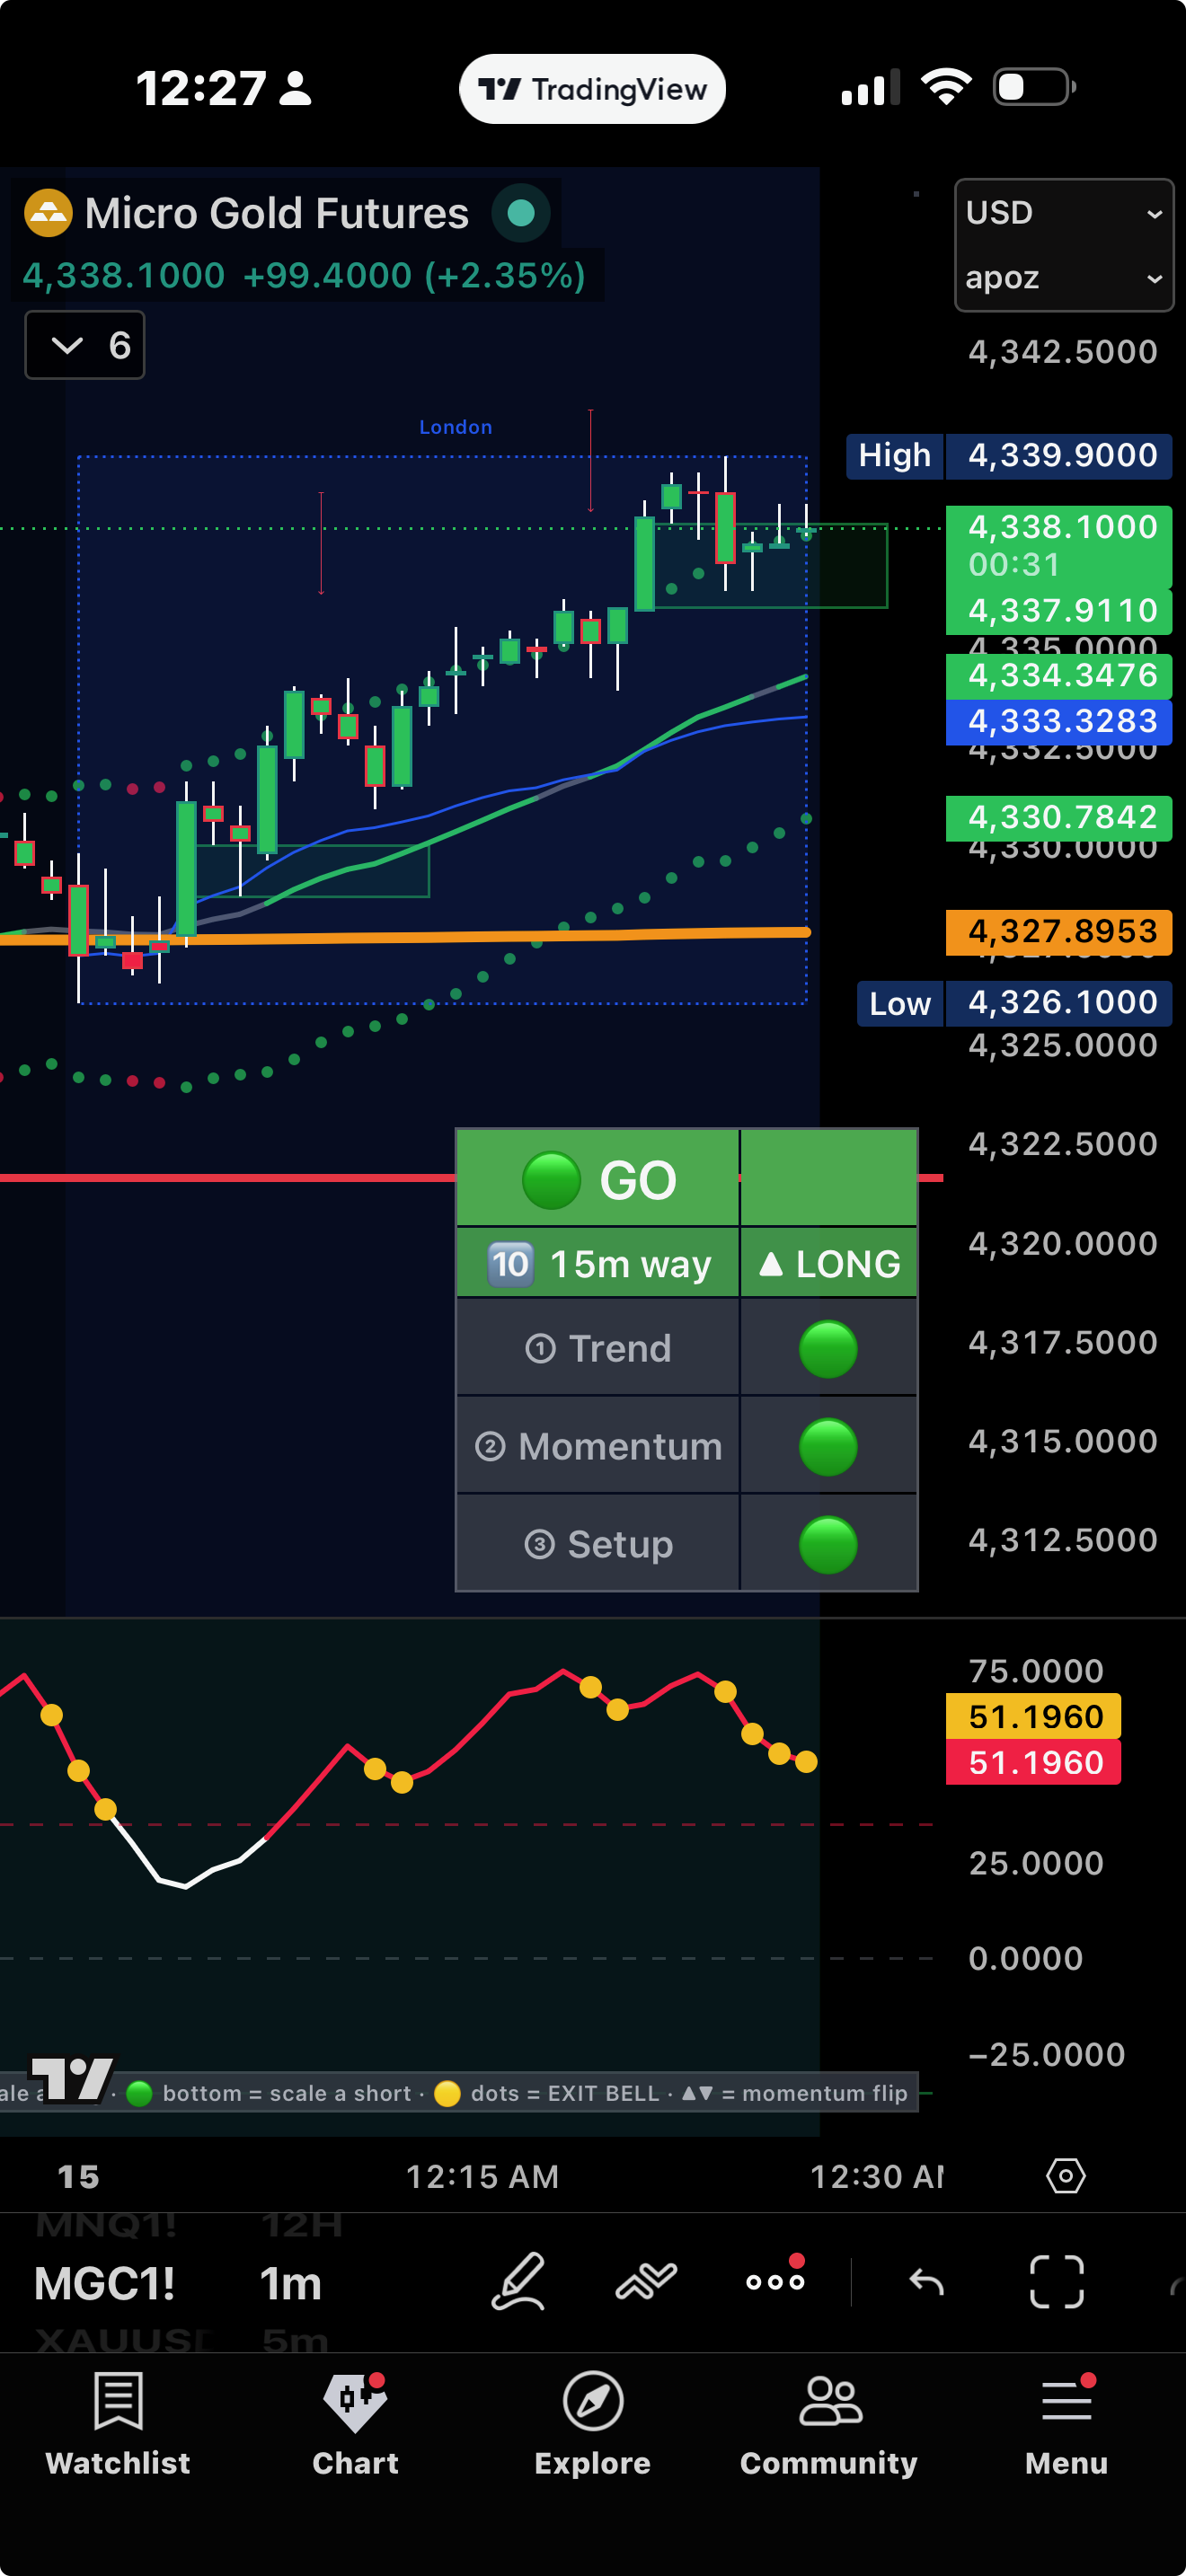
The GLS dashboard — GO panel, the 3 green lights, the 15m-way read
The dashboard answers the four questions in order: which way, is it real, where do I get in, when do I stop.
🎯 The DIRECTION panel (bottom-left)
Four timeframes stacked: Day · 4h · 15m · 5m, each ▲ UP or ▼ DOWN.
All green = strong long. All red = strong short. Mixed = wait / lower confidence.
The header shows the overall lean: STRONG LONG · leaning LONG · MIXED · leaning SHORT · STRONG SHORT.
This is your bias. Trade with it, never against it.
🟢 The 3 Green Lights (bottom-right)
① Trend — there's a clean trend (not chop).
② Momentum — momentum is healthy (not exhausted).
③ Setup — a real entry is actually present.
Plus your live day P&L and Win %.
Three white = nothing yet. The lights turning green = the pieces lining up.
🚦 The Status Banner (center)
One plain-English instruction that walks you through the whole trade:
🔮 GET READY → 🟢 SYSTEM GO → 🟢 IN A TRADE, RIDE IT → 🚀 RUNNER, LET IT RIDE → 🛑 DONE FOR THE DAY
It also says CHOP — STAND ASIDE, CLOSED, and STAND DOWN (daily limit hit).
🚦
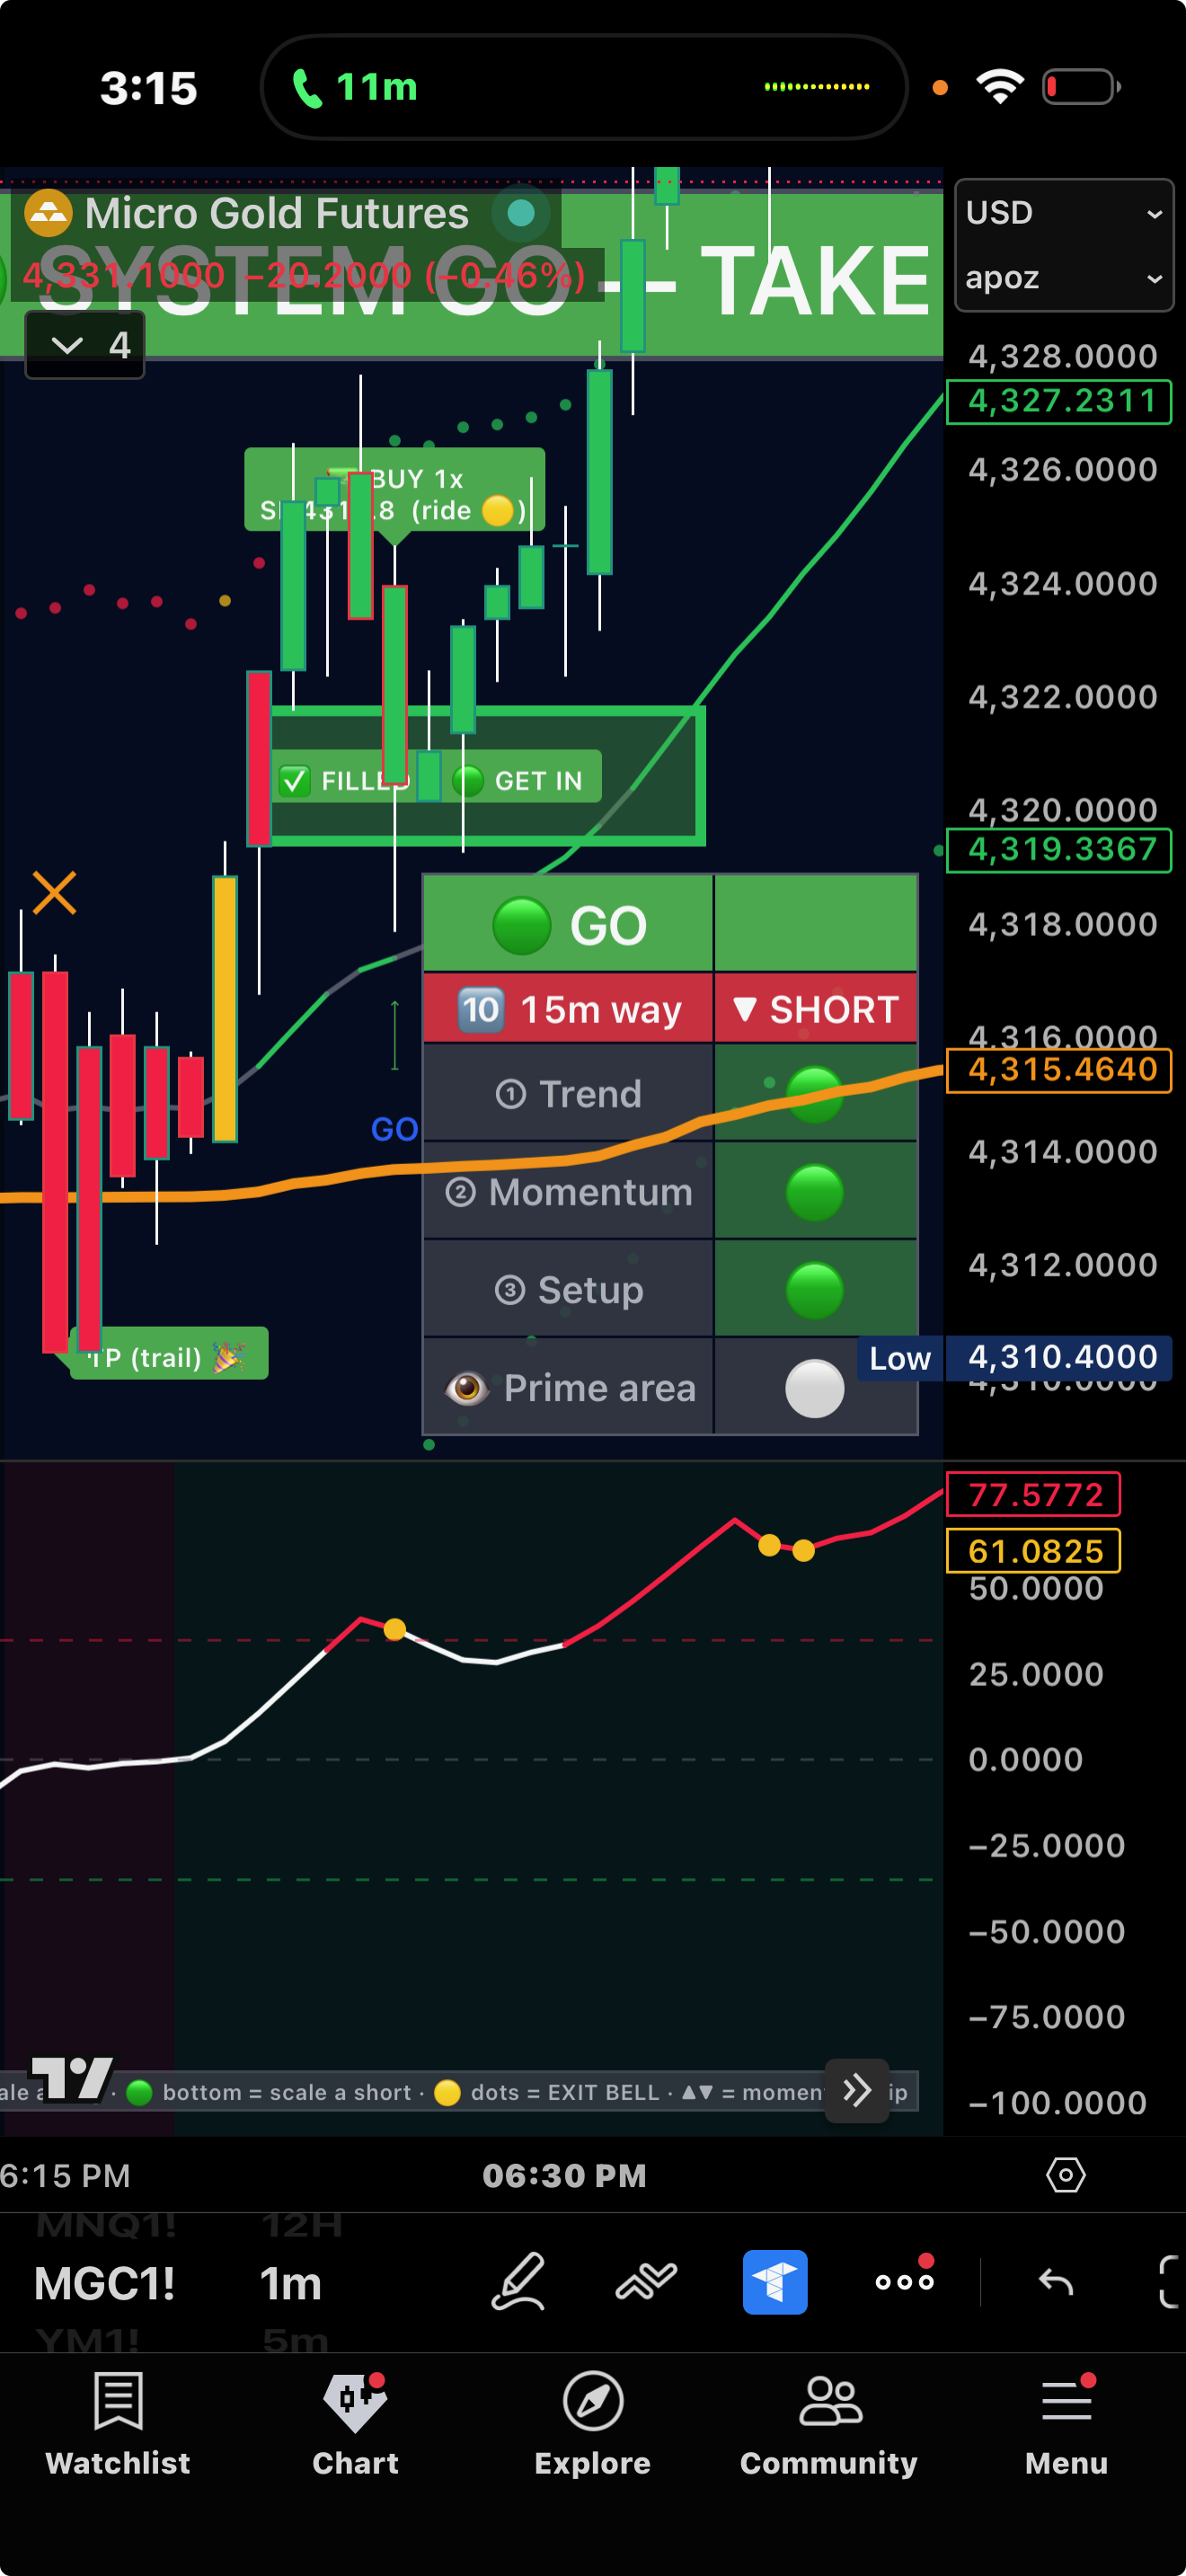
The banner is the final wordThree green lights alone is not a green light — wait for the banner to say SYSTEM GO.
05
The Signals (the lights on the chart)
GLS marks entries as simple lights, never cluttered "BUY/SELL" text:
🟢 Green dot = long signal🔴 Red dot = short signal• Small dot = standard💎 Large dot = STRONG (A+)
Small dot = a standard signal. Large dot = 💎 STRONG — the A+ version, when all four timeframes also agree. The large dot is your highest-conviction trade.
Every dot is with the trend, confirmed on a closed candle, with above-average volume, inside the session, and out of chop. GLS does not fire random counter-trend signals.
When a signal fires, GLS also draws the ticket: entry, 🛑 stop-loss, 🎯 target, and position size in contracts — so you know exactly what to do.
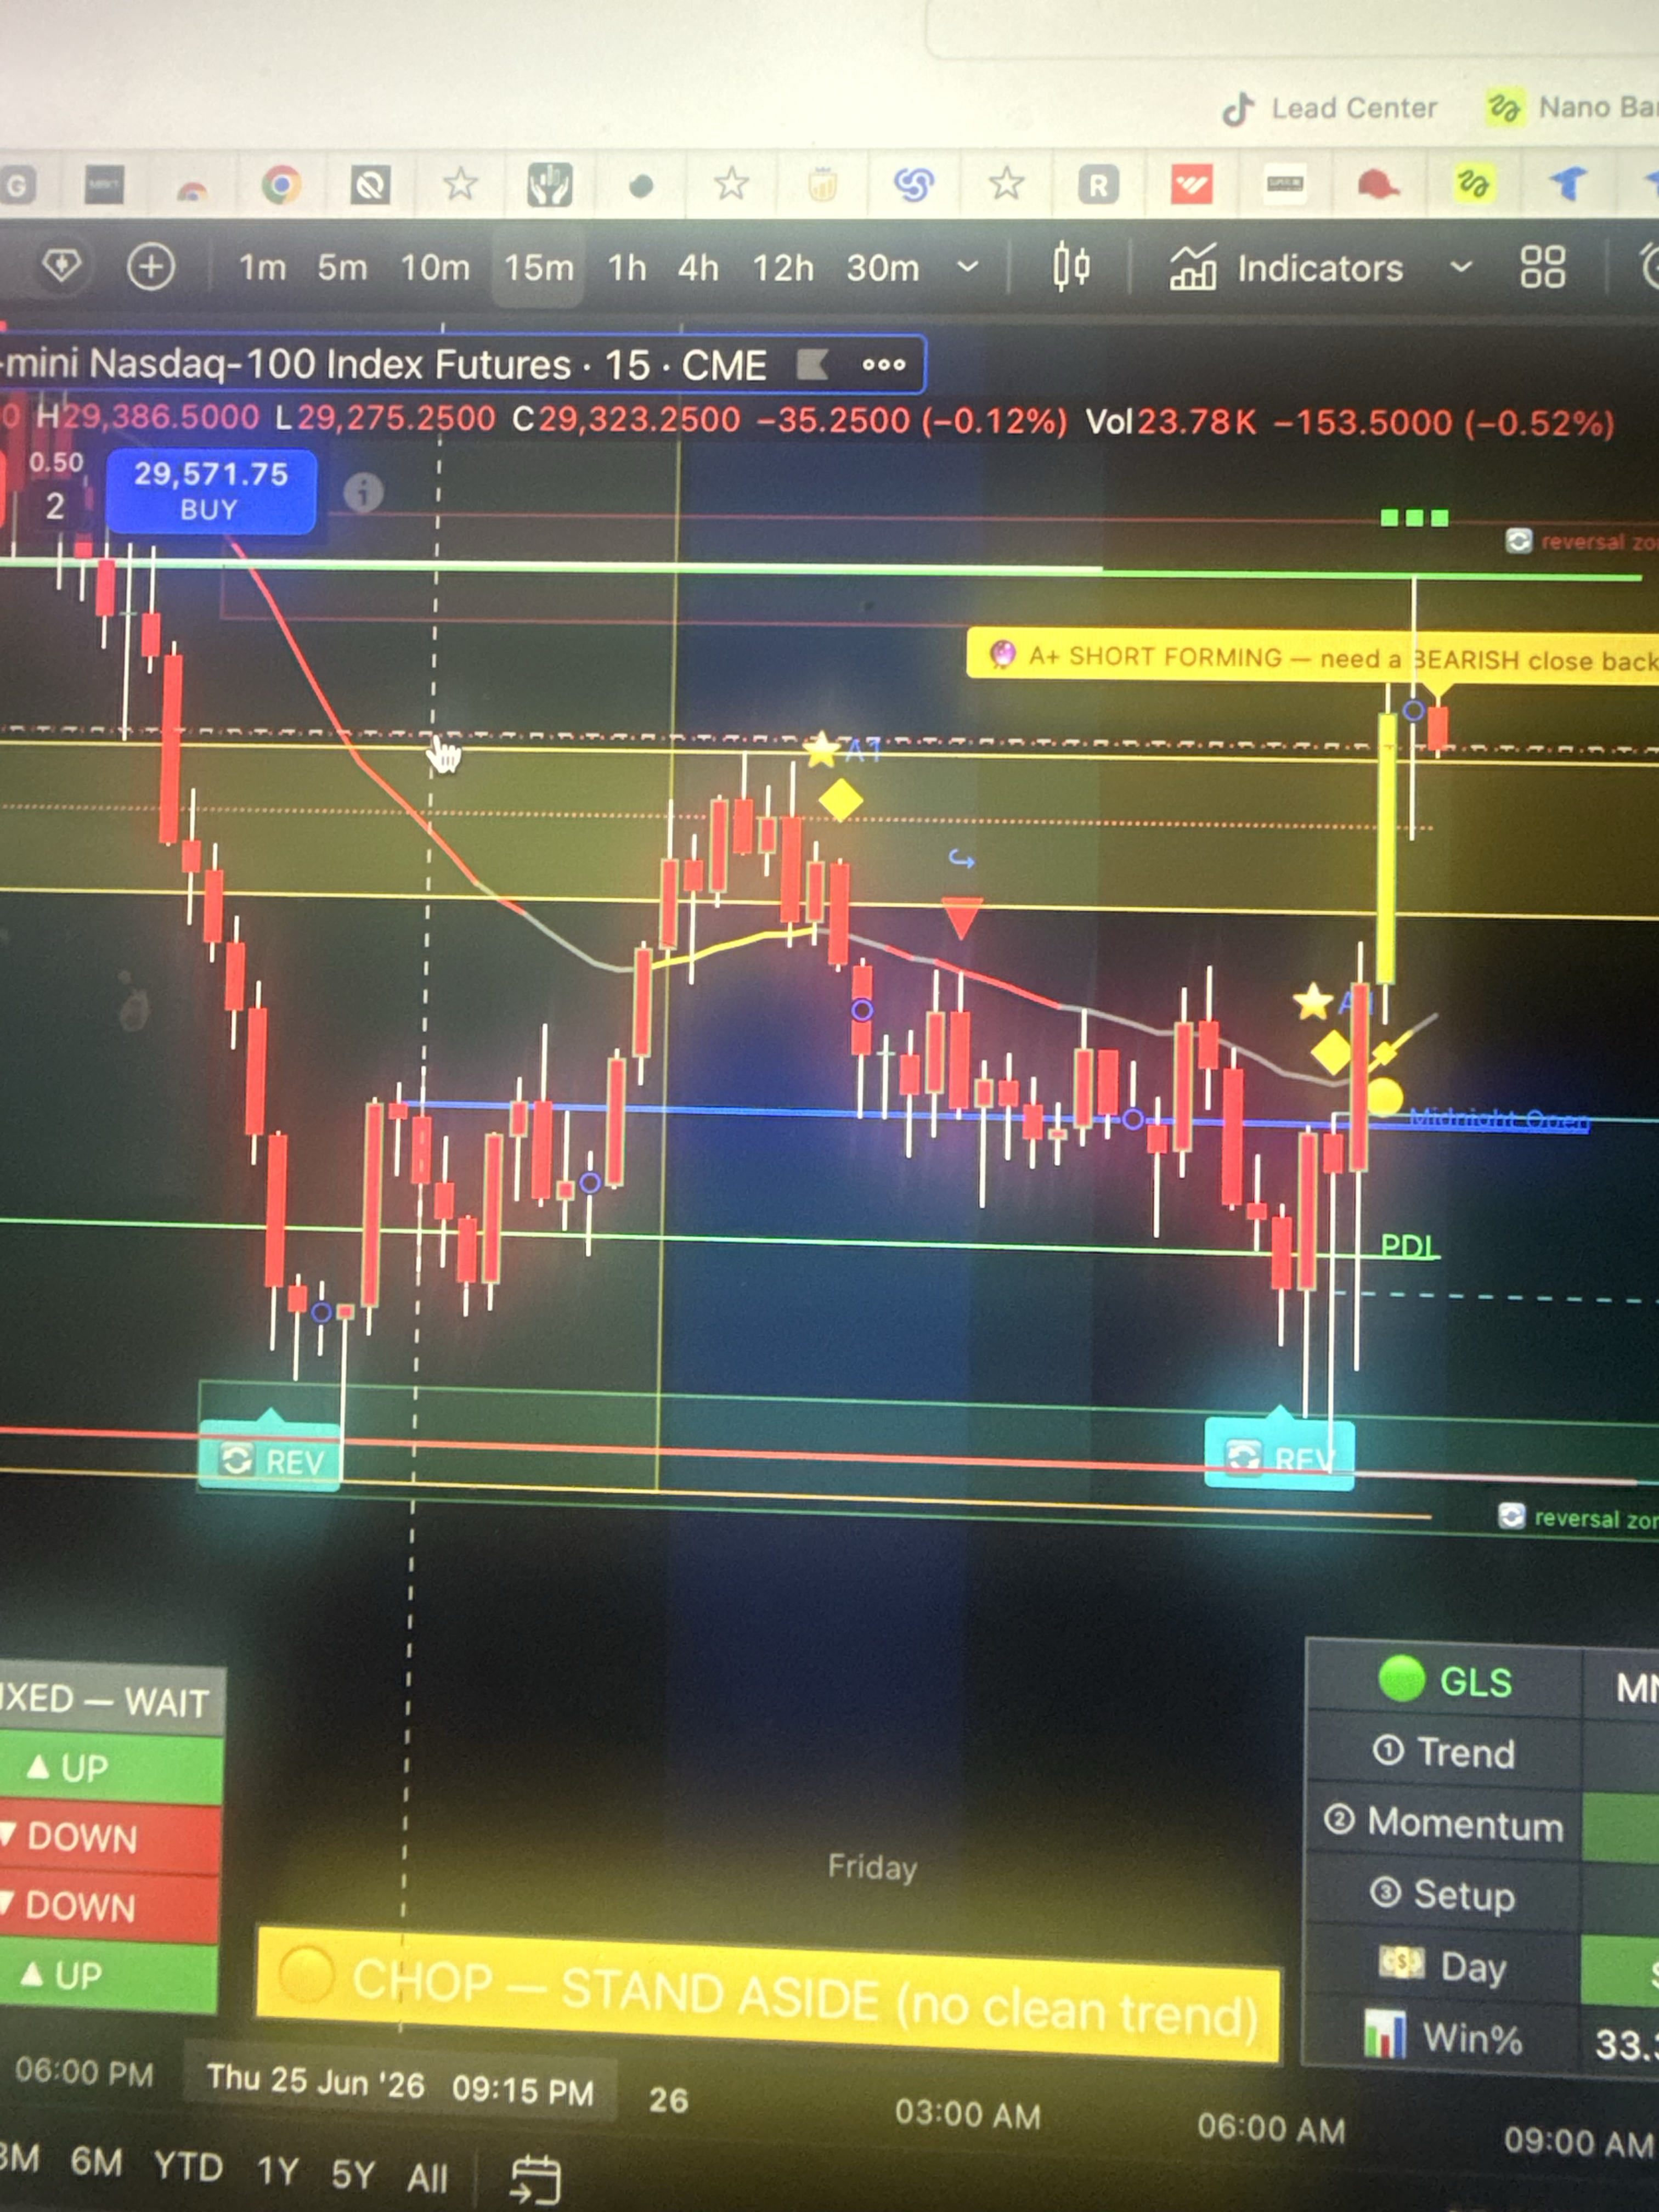
SYSTEM GO — the banner says TAKE IT, the FVG flips to ✅ FILLED — GET IN, and all three lights are green
06
The Zones (where the action happens)
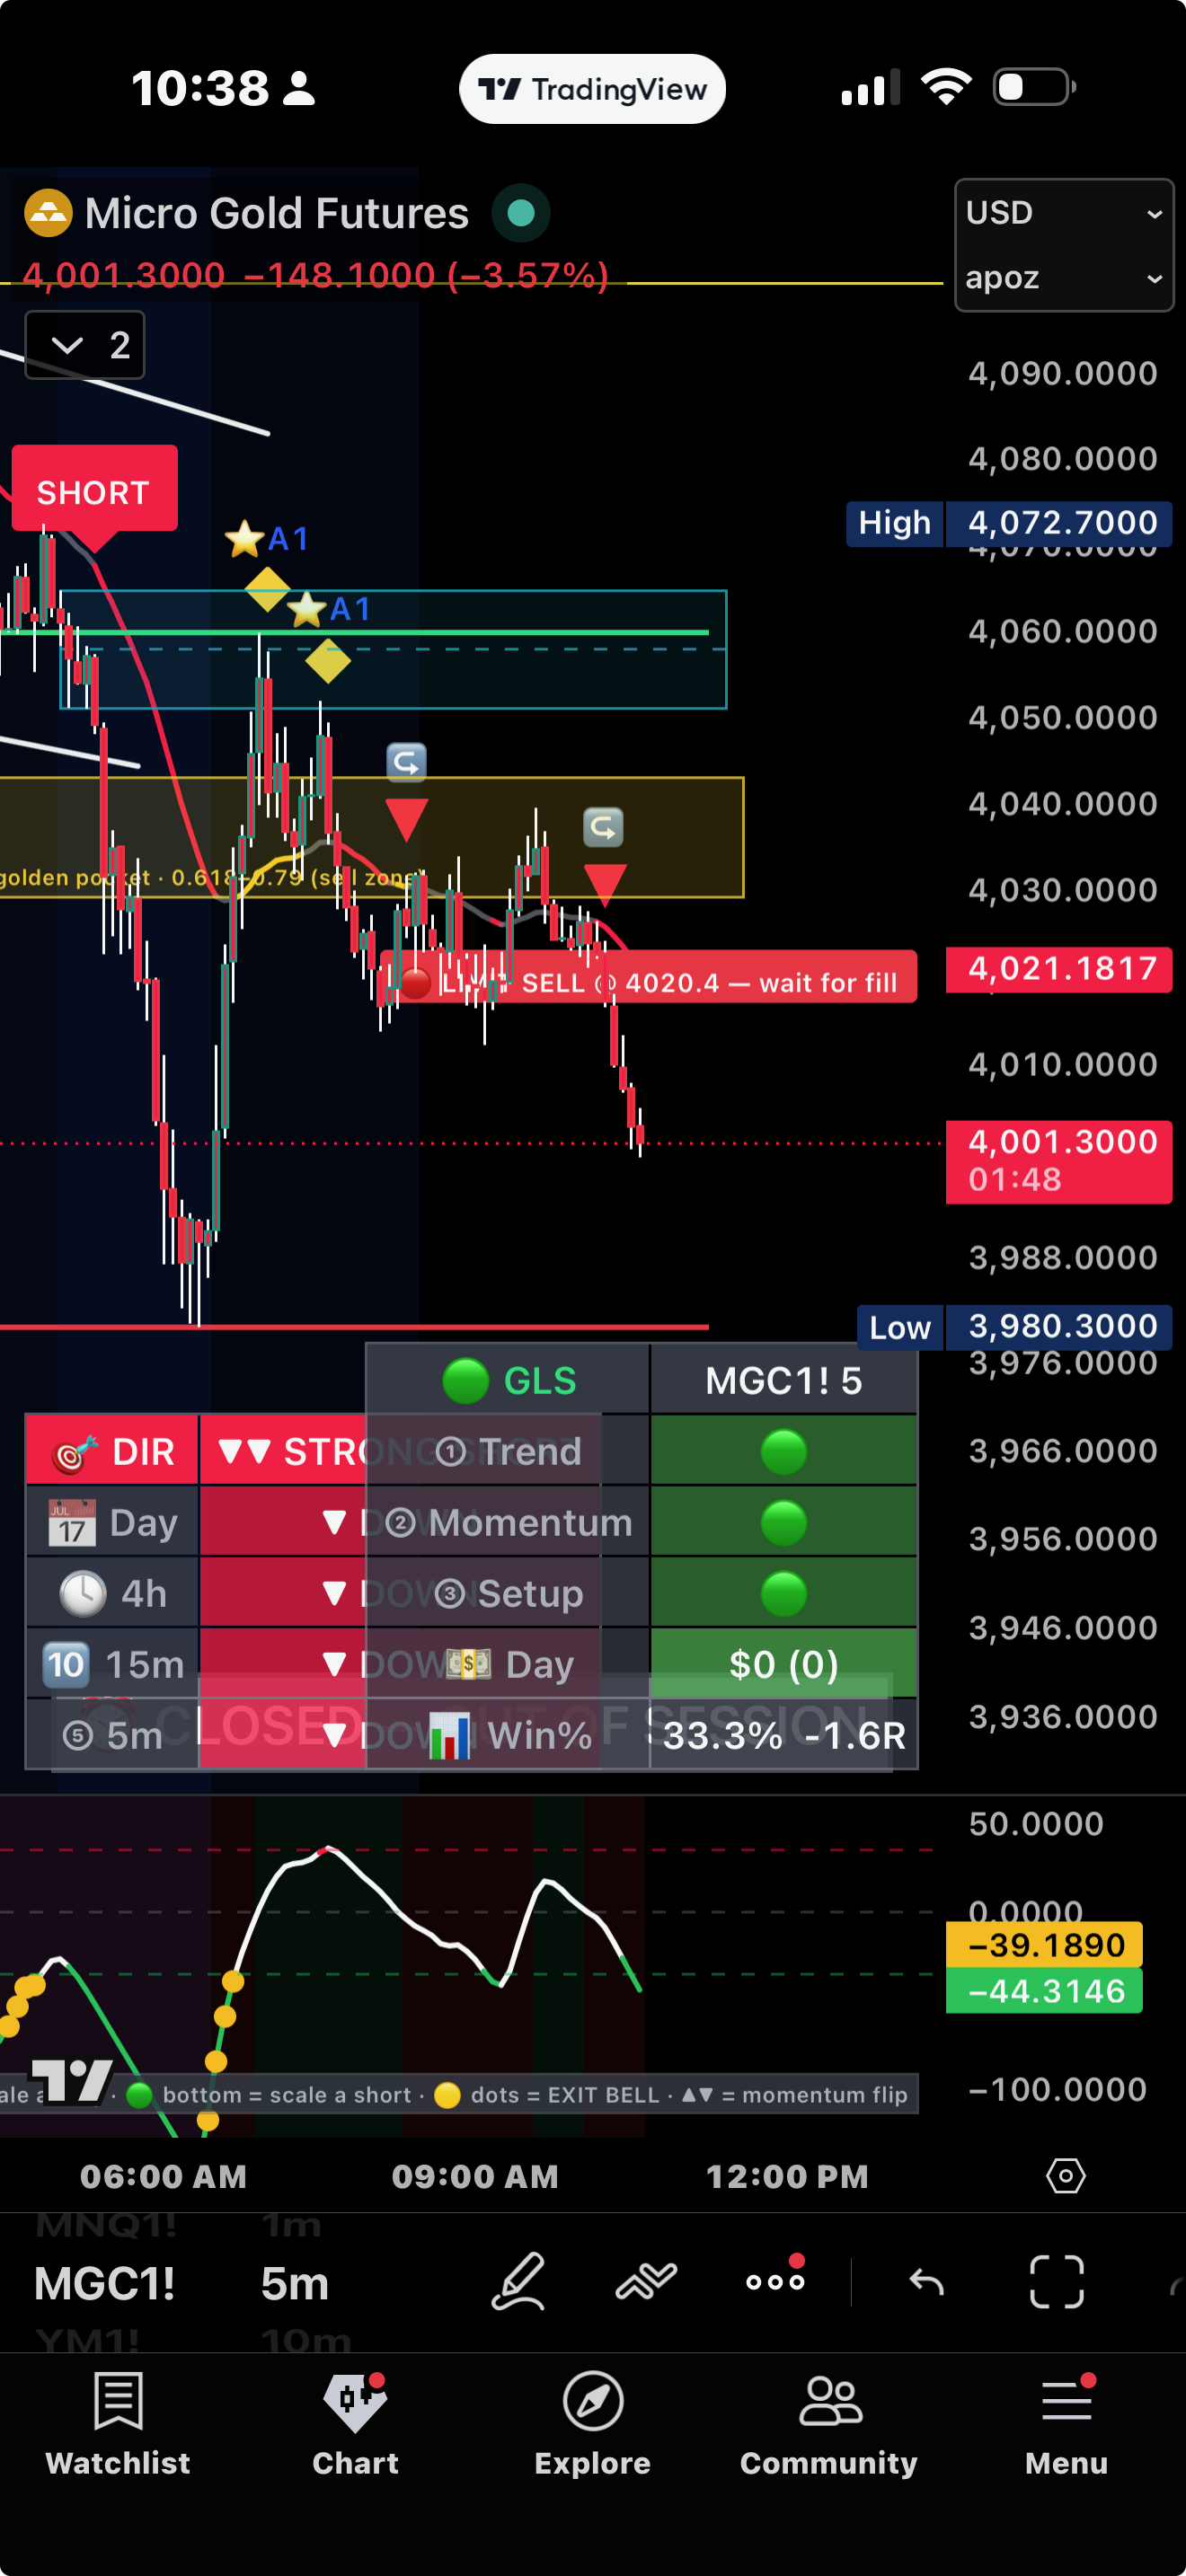
Golden pocket (sell zone) + ⭐A1 setup + 🔄 reversal zone + a limit waiting for fill, in a STRONG SHORT trend
⭐ Golden Pocket (yellow band) — the 0.618–0.79 institutional retracement, the prime pullback entry zone. It orients to your trend: leaning long → it's a buy zone; leaning short → a sell zone.(They can never disagree with your DIR lean.)
🔄 Reversal Zones (shaded boxes at key highs/lows) — where price tends to stall and turn. Great for exits and for spotting where a pullback may end.
🛡 Strong Support / 🧱 Resistance (optional, toggle on) — levels tested 2+ times that held. The bounce/rejection spots.
🚀 Opening-Range Breakout (ORB) — the session's opening range; a volume-backed break in the trend direction is a classic play.
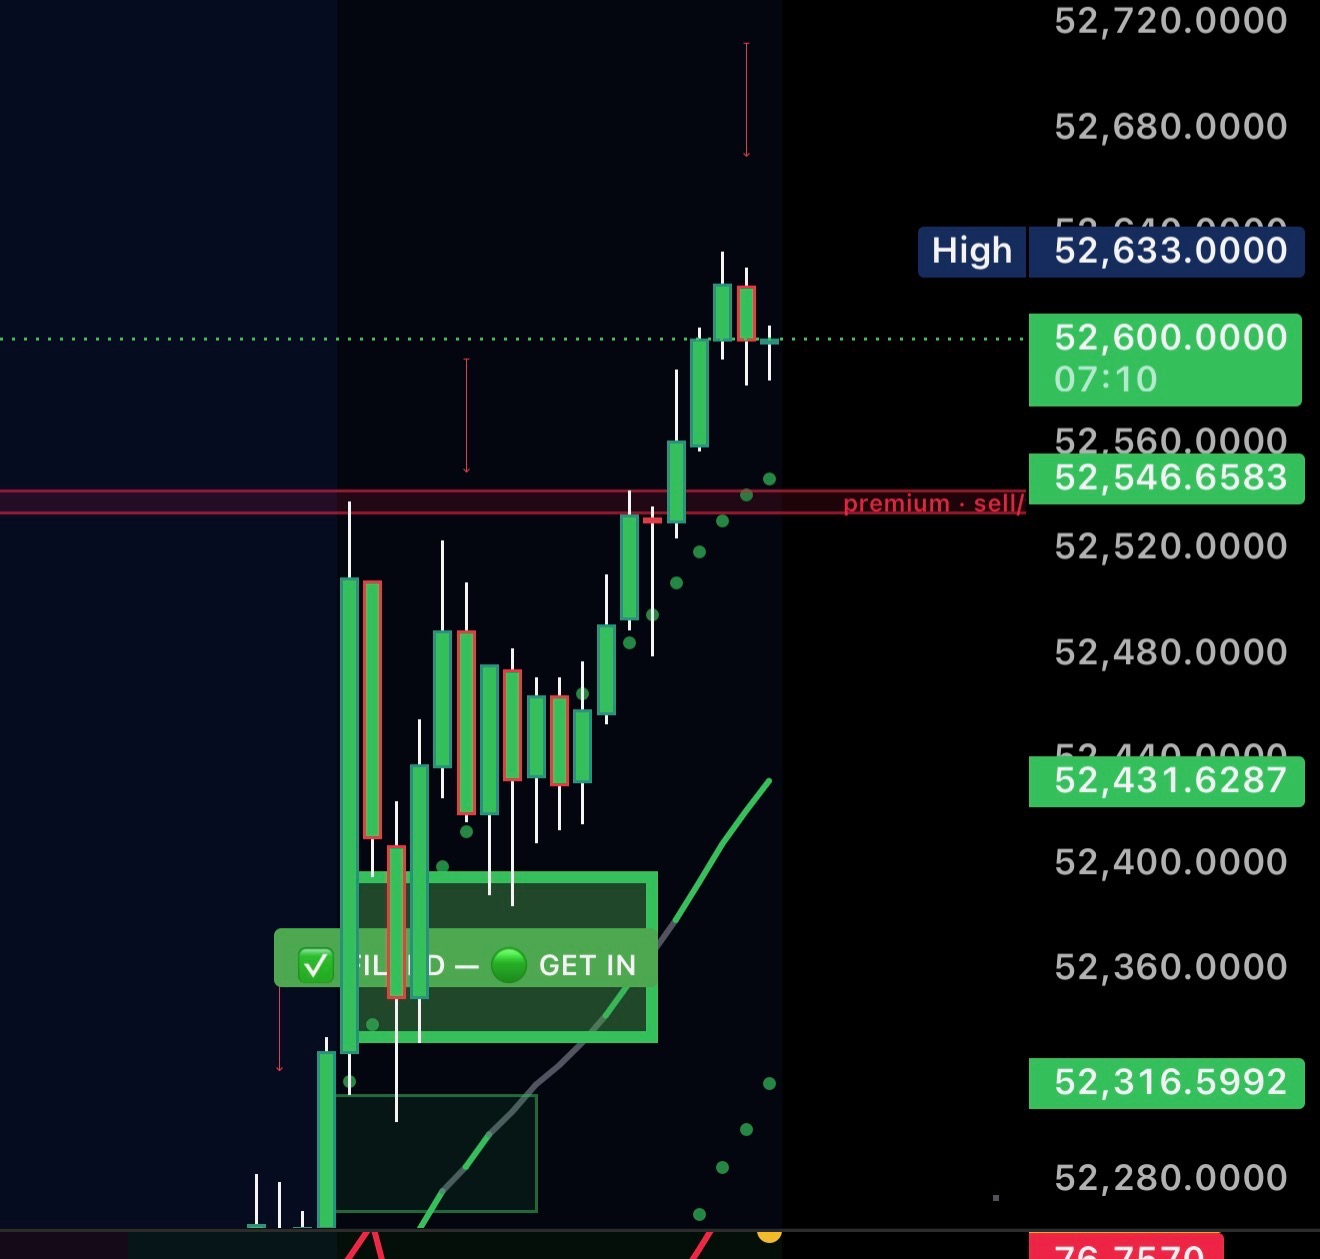
📦 Fair-Value Gaps (FVG) — a gap is highlighted as it forms and reads "wait for fill." When price returns and tags it, it flips to "✅ FILLED — GET IN." That's your heads-up the pullback reached the gap.
A gap flips to "✅ FILLED — GET IN" as price tags it, just under the premium·sell line
📊 VWAP (yellow line) — institutional fair value. Above it favors longs, below favors shorts; great for managing a runner.
07
The Yellow Man (warning, NOT a buy)
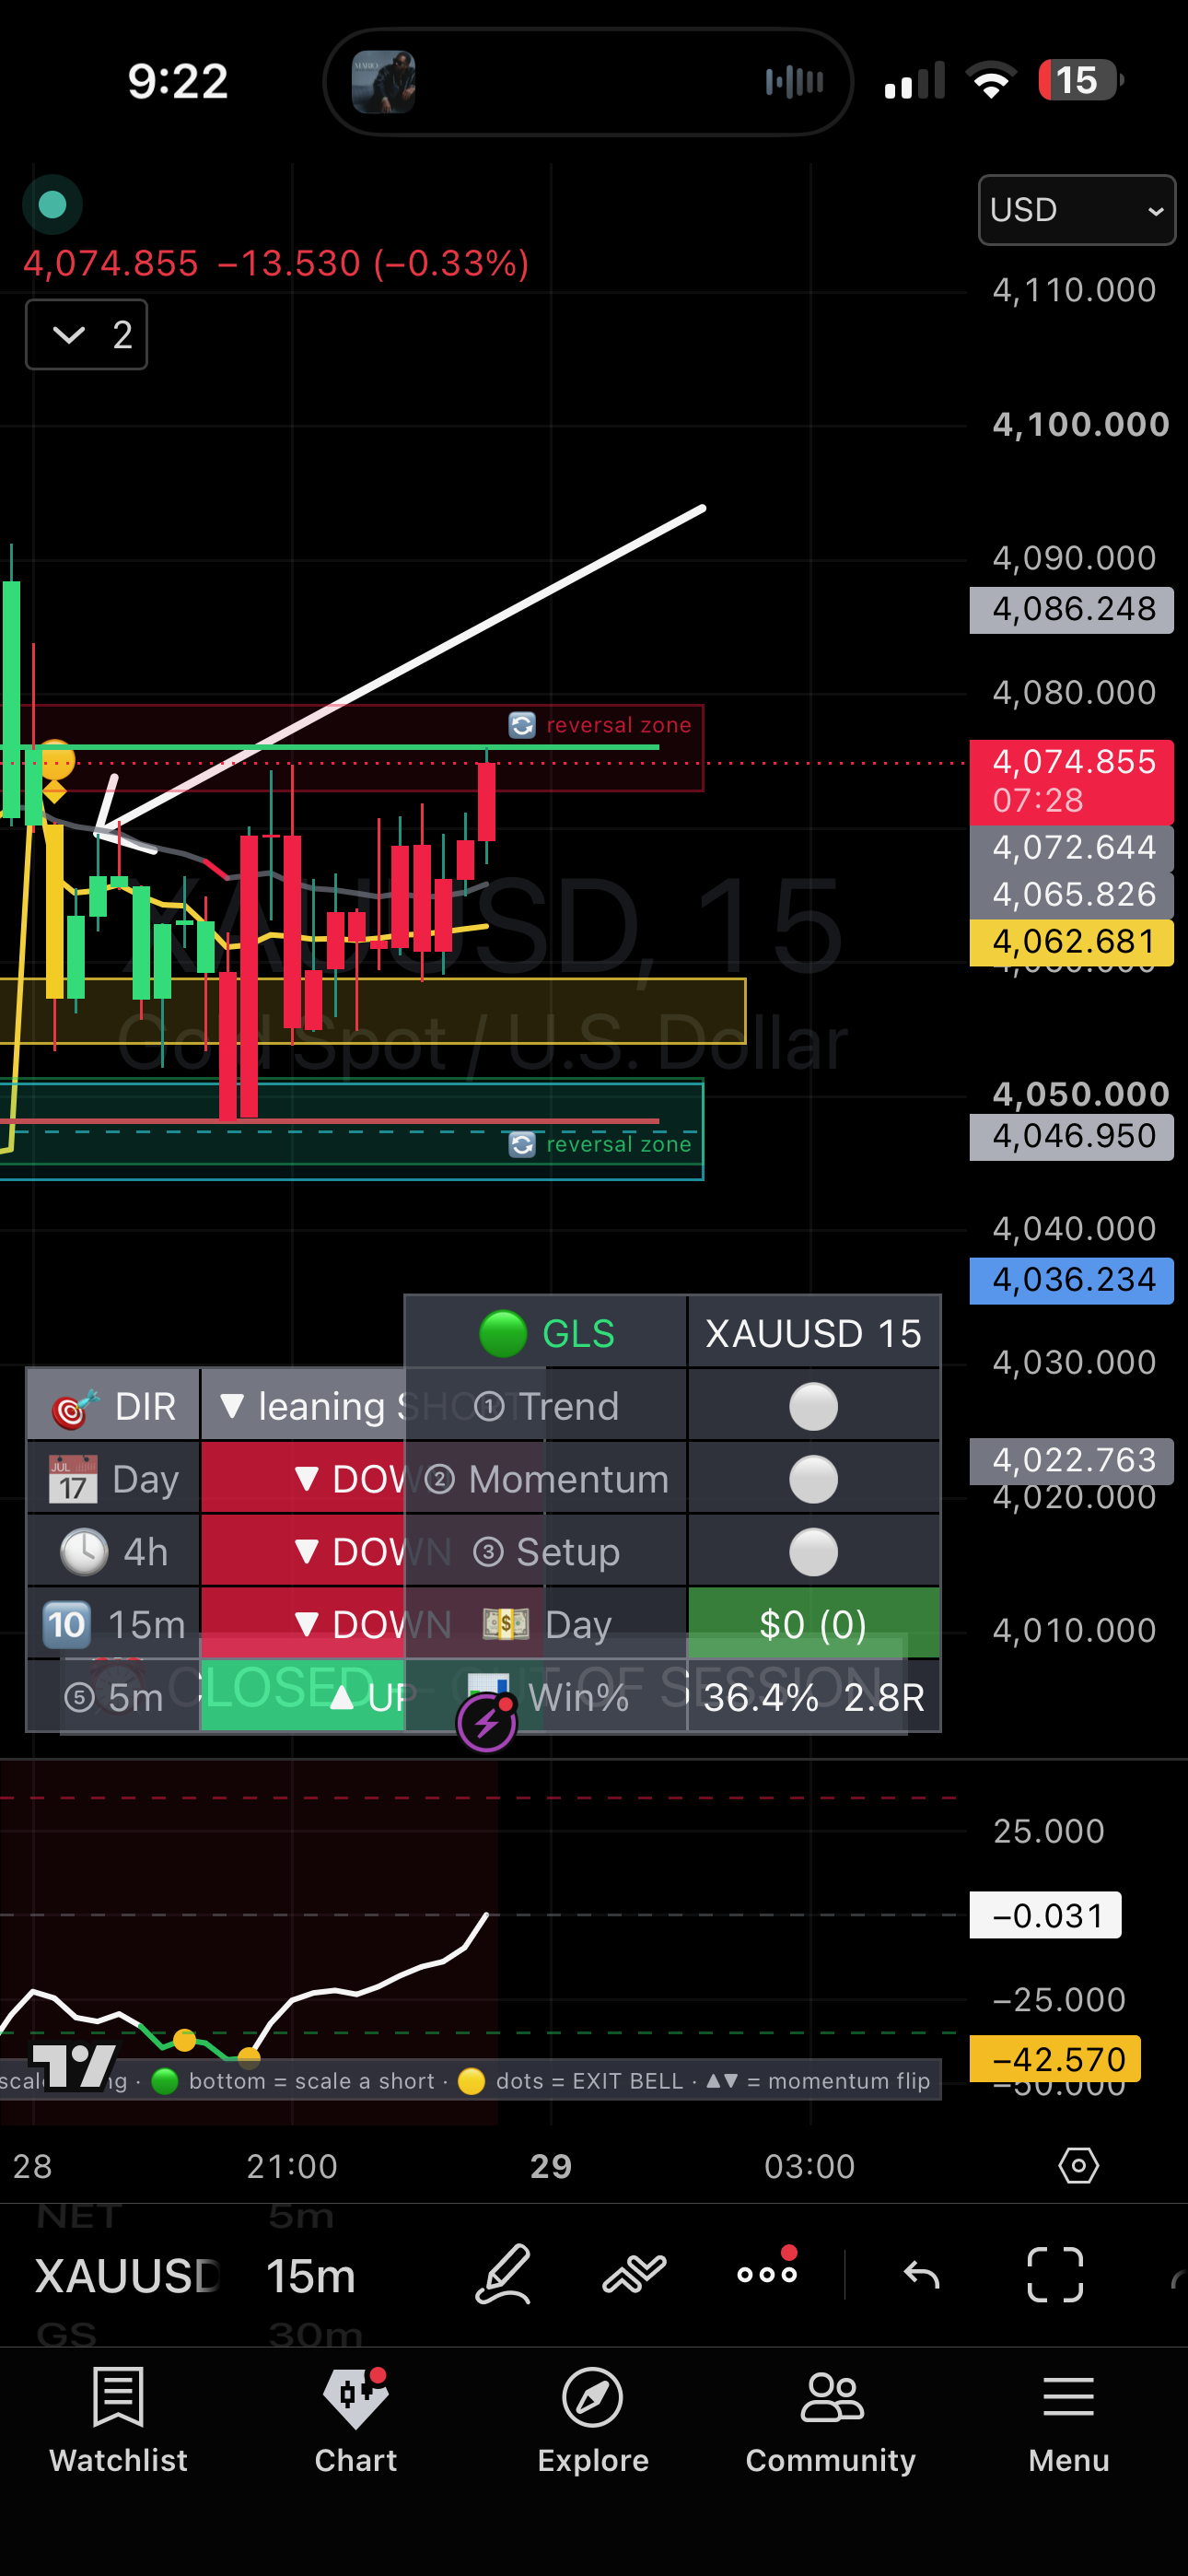
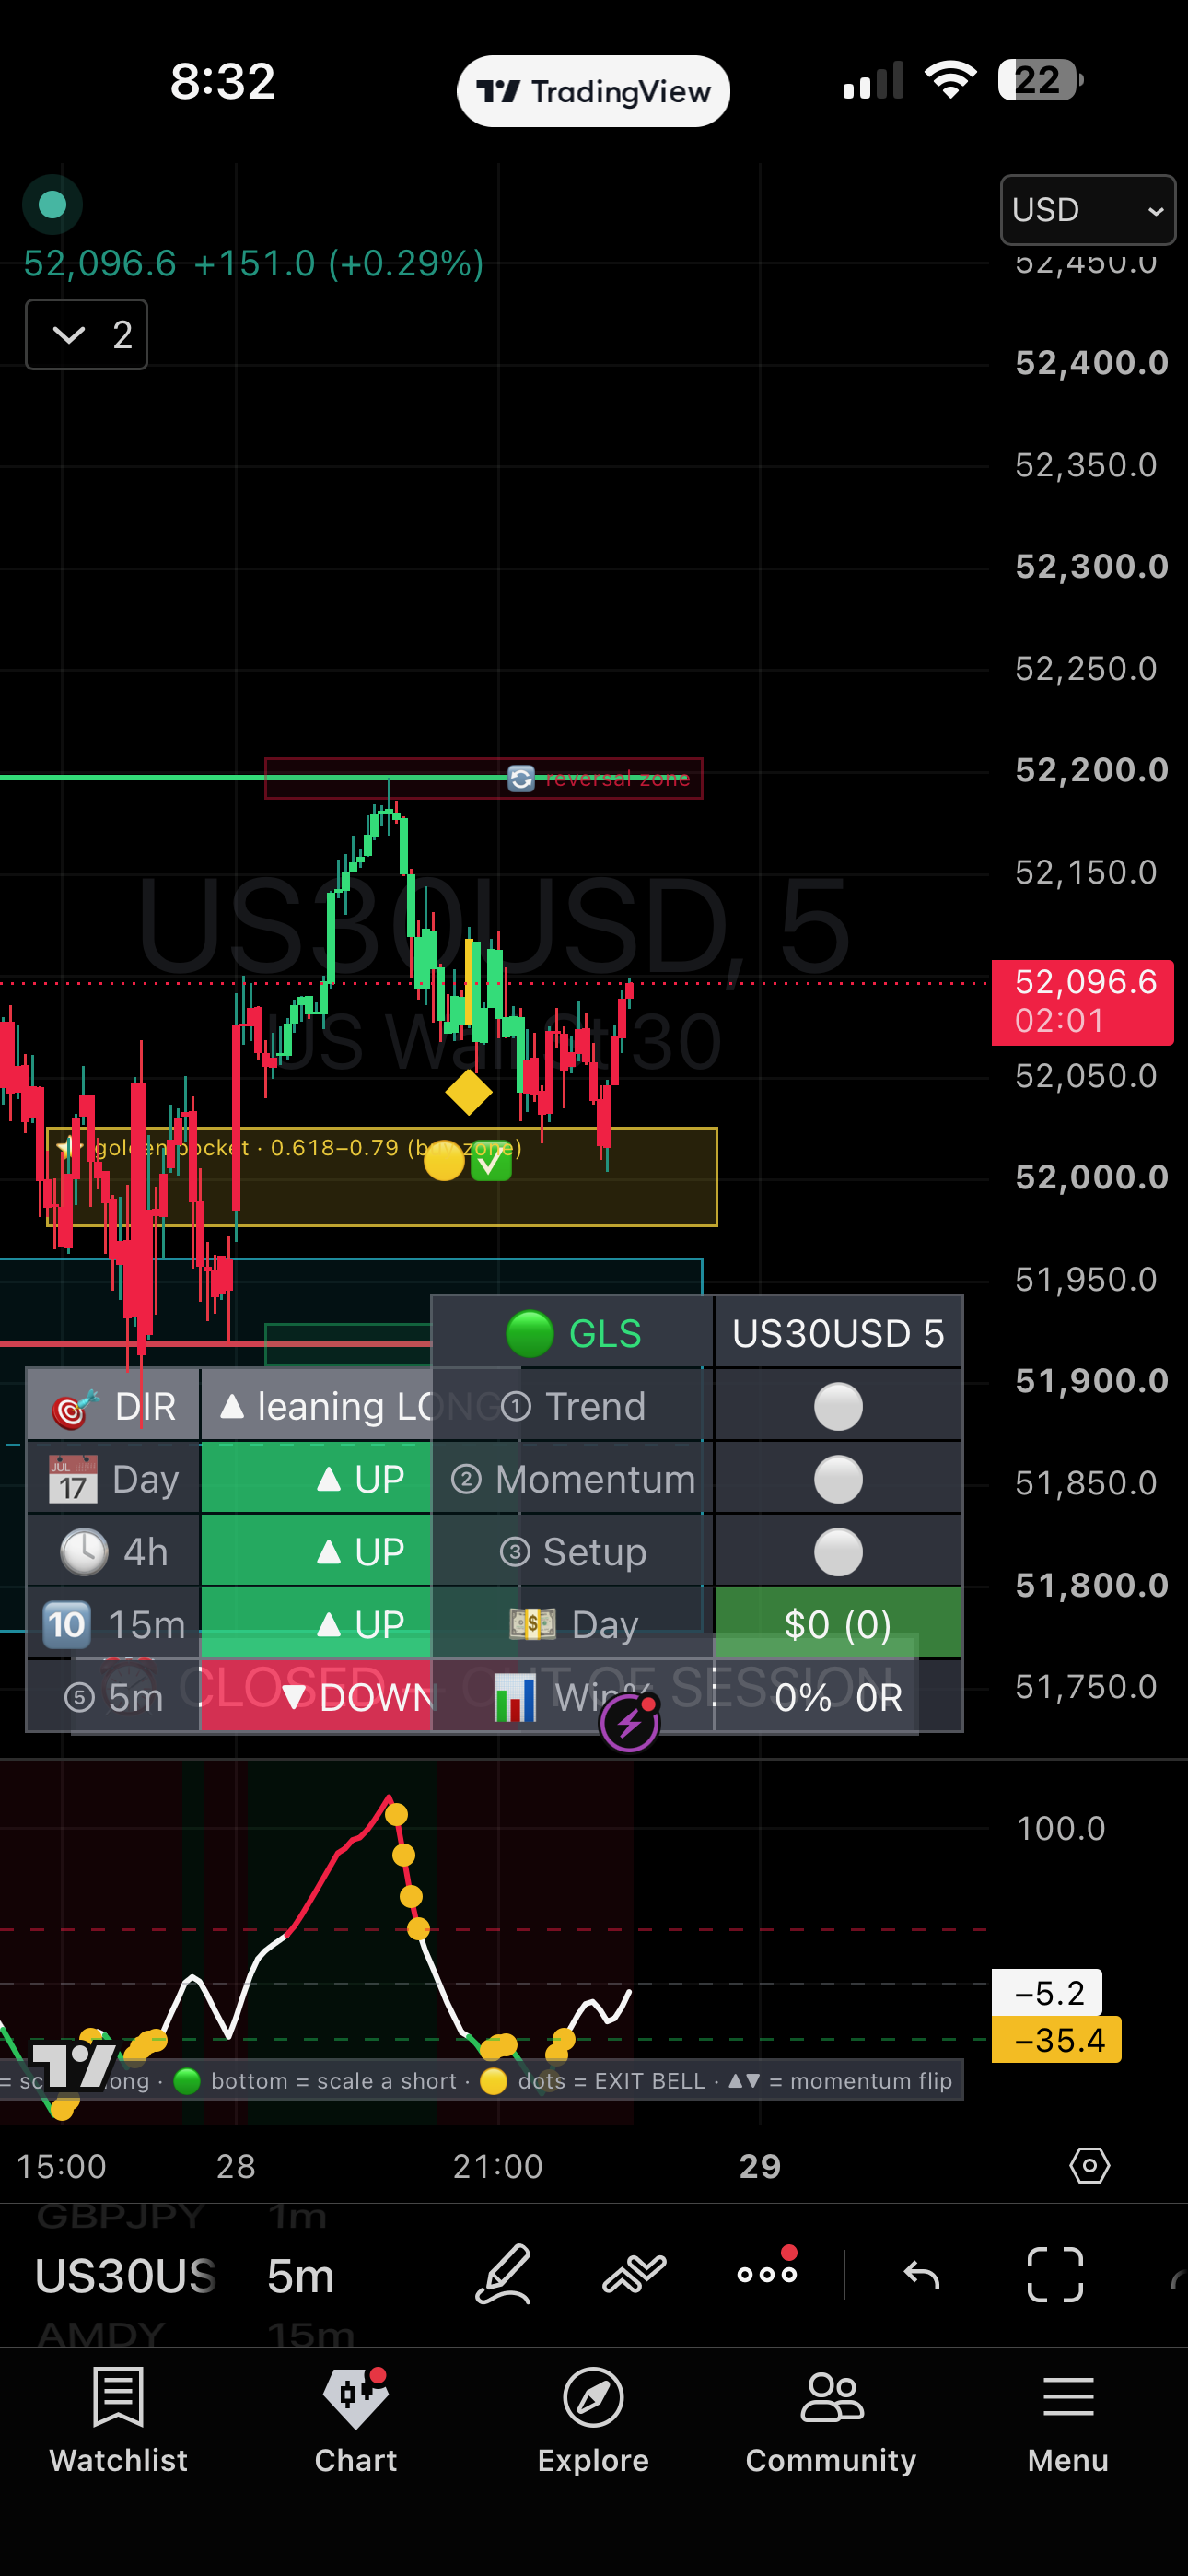
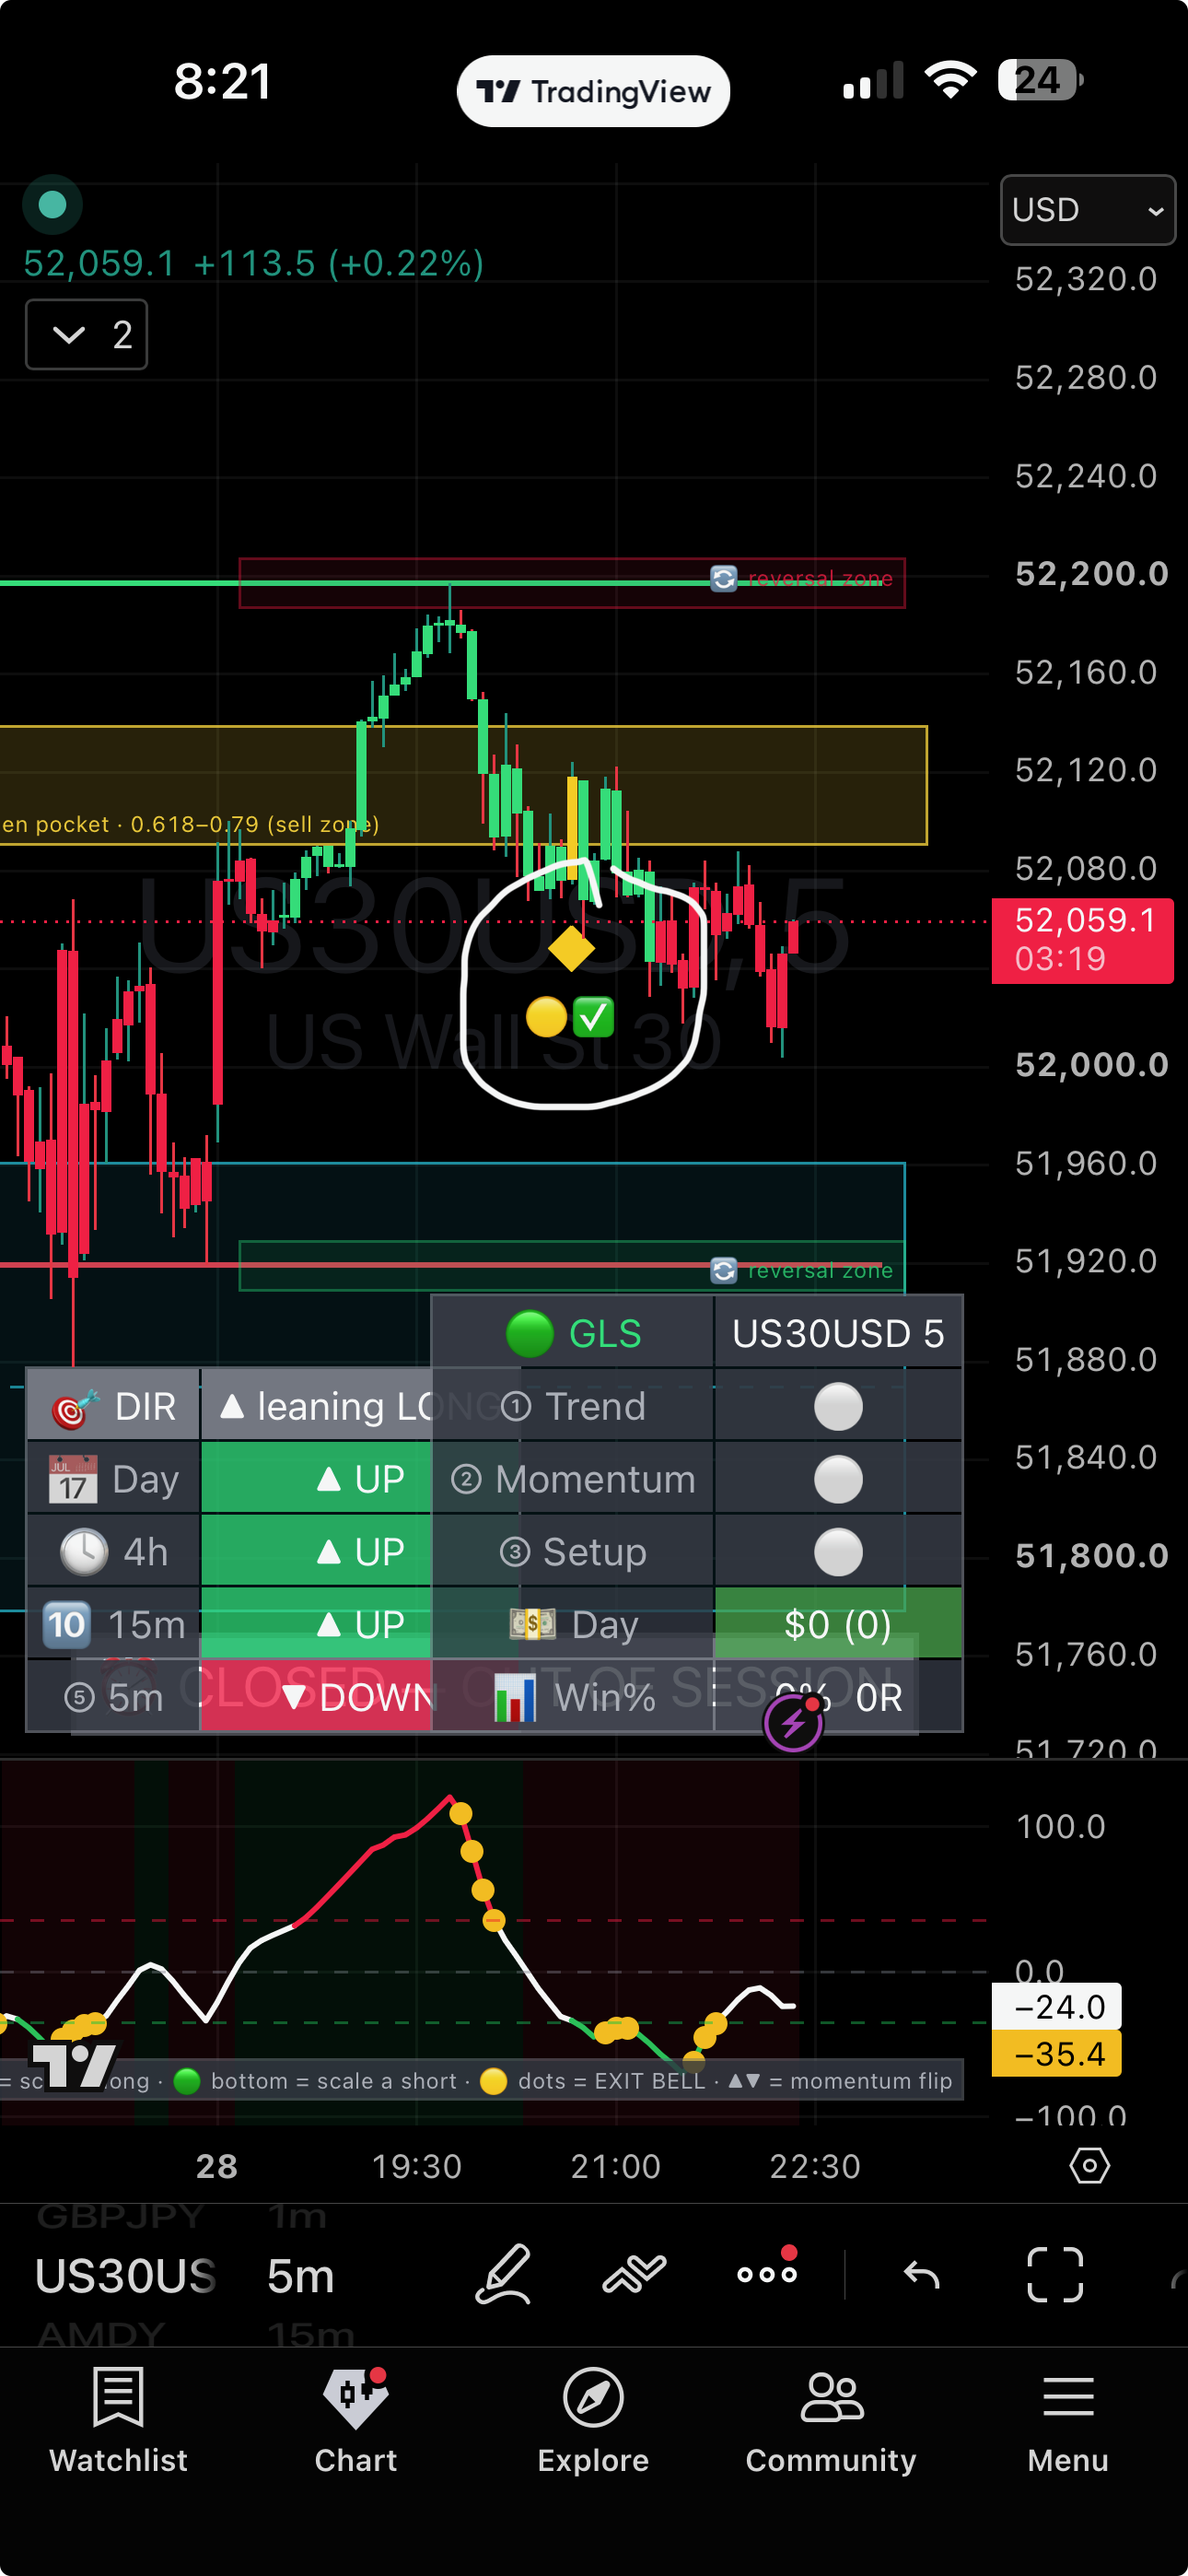
Yellow Man flip in a downtrend — a warning, not an entry
The 🟡 Yellow Man paints a candle yellow when short-term momentum flips. It is a WARNING — "heads up, something may be turning" — not an entry.
🟡
Do not trade on yellowYellow = get ready. Green light + banner GO = go.
⚠️
Critical — fake-out warningIf the Yellow Man flips against your DIR trend (e.g., a flip-up while leaning SHORT), that's usually just a pullback / bounce — a fake-out, not a real reversal. In the example above, the trend is DOWN (Day/4h/15m down), so that yellow pop-up is the bounce before price resumes lower — a place to look for a short continuation, not a long. The system won't hand you a long there, and that's correct.
08
GLS OSOB — your exit tool, full breakdown
OSOB is the second indicator in your bundle. It sits in its own pane below the price chart, and it has one job: tell you when to GET OUT / take profit. GLS gets you in; OSOB tells you when the move is running out of gas.
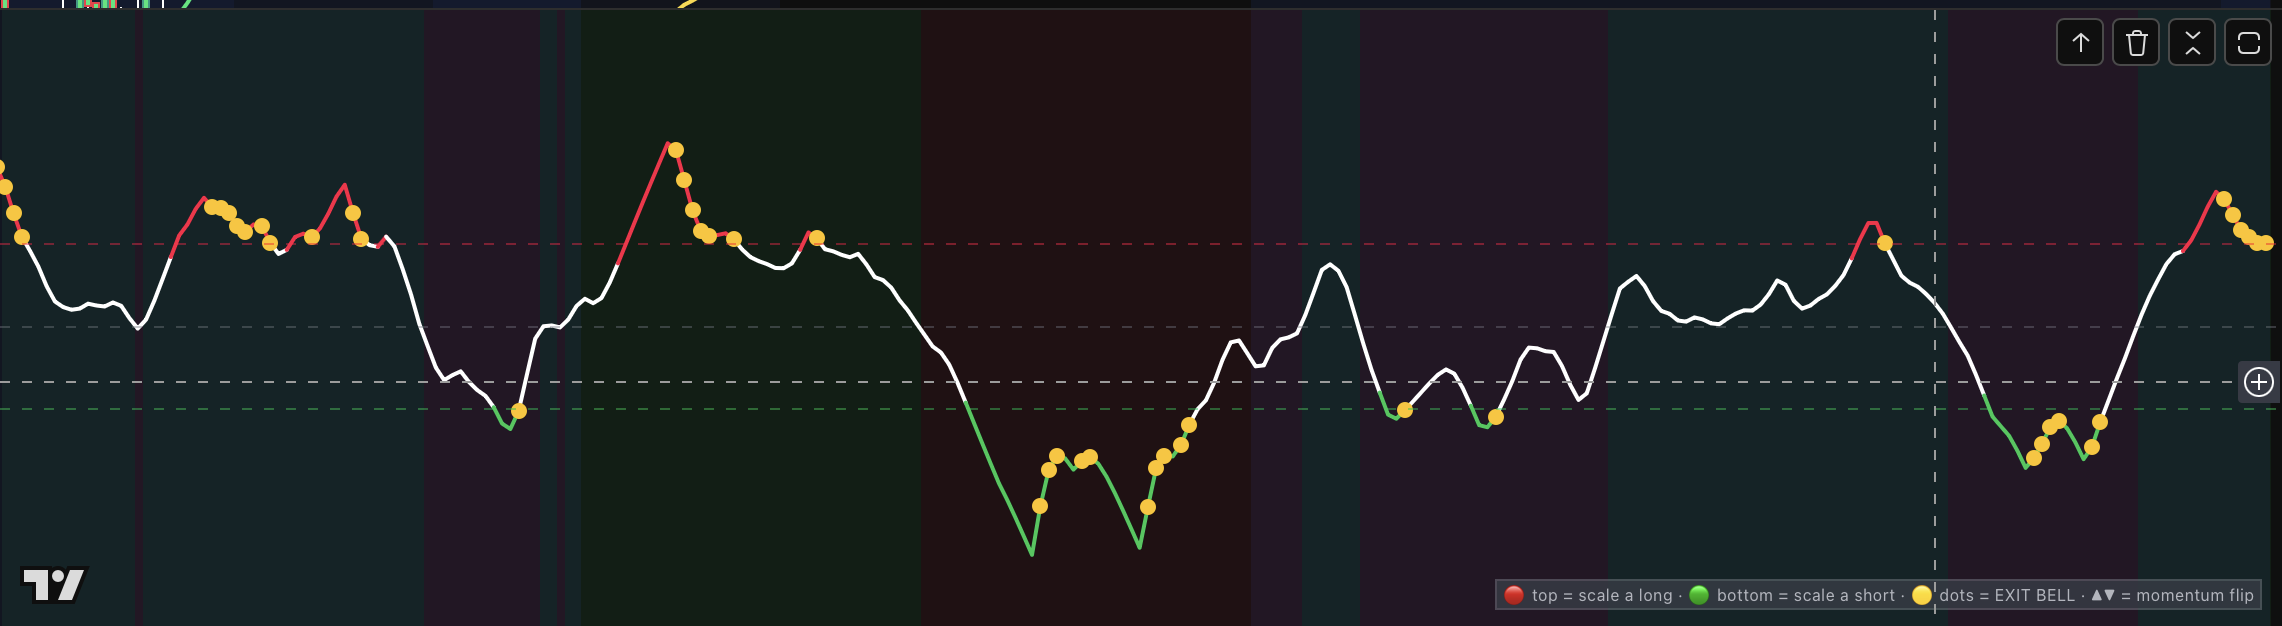
The OSOB pane — the wave, red tops, green bottoms, and the 🟡 gold exit-bell dots
What it is
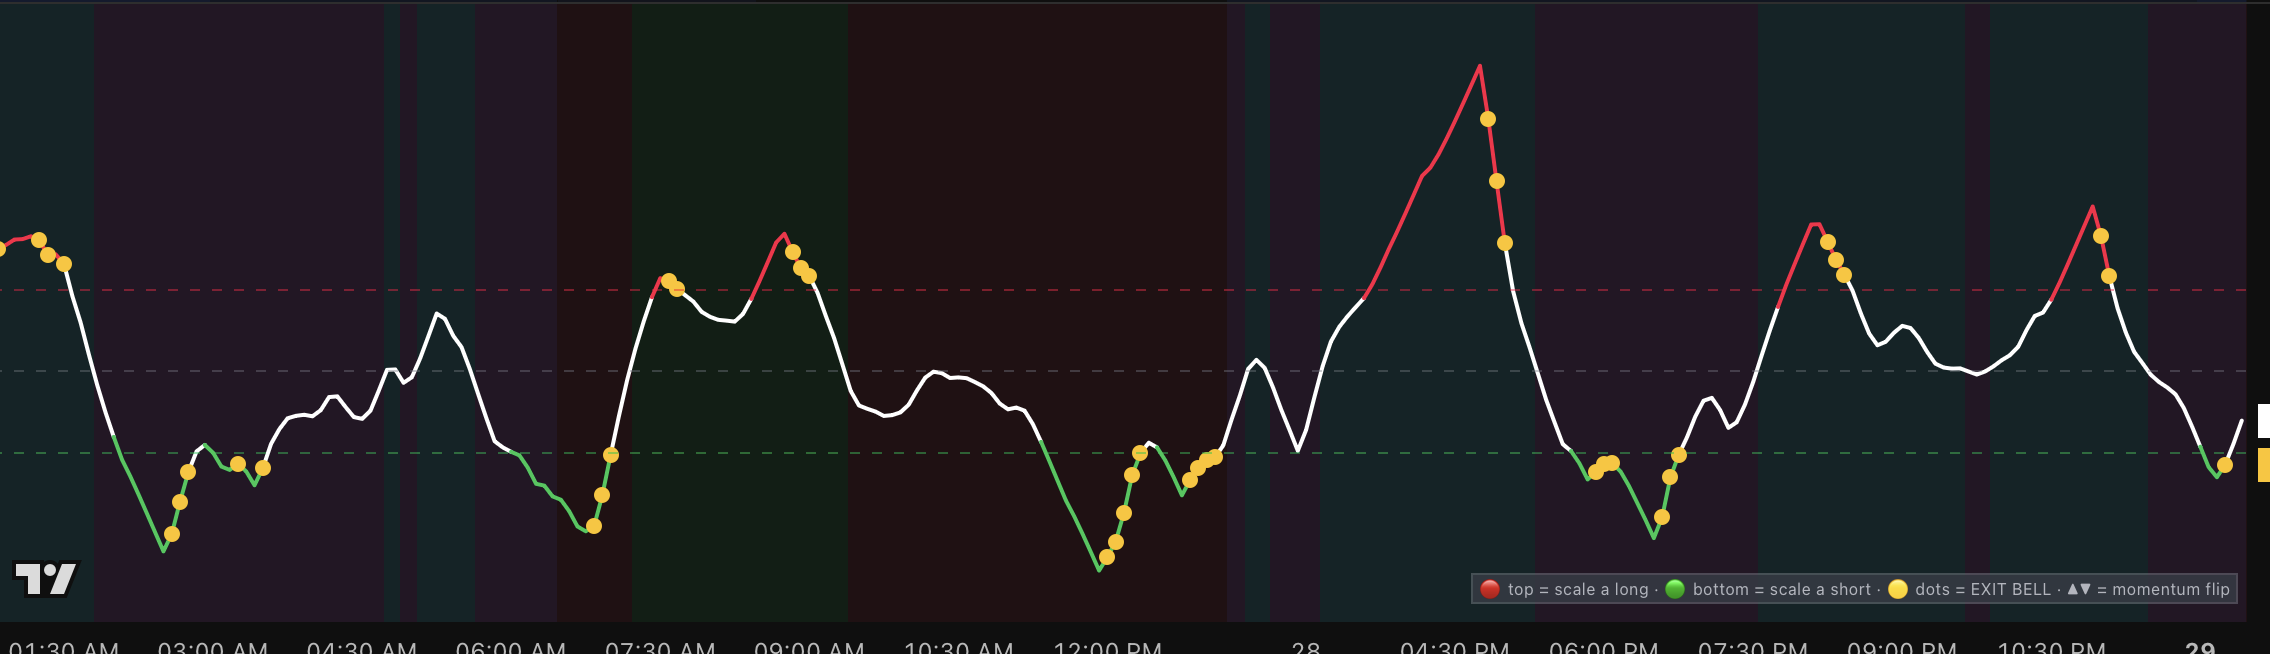
A smoothed momentum wave (built on an Ehlers Fisher Transform of a Fibonacci channel). It swings between roughly +120 and −80, centered on 0, and it snaps at turns so tops and bottoms are obvious instead of rounded over.
The 3 reference lines
🔴 Red dashed (~+40) = OVERBOUGHT — the up-move is stretched.
⚪ Gray dashed (0) = neutral midline.
🟢 Green dashed (~−40) = OVERSOLD — the down-move is stretched.
The wave color = where momentum is
⚪ White, drifting → momentum is healthy → let your trade ride.
🔴 Turns red at the top (above +40) → a long is getting tired → first target / scale out.
🟢 Turns green at the bottom (below −40) → a short is getting tired → cover / scale out.
🟡 GOLD dots = the EXIT BELL (this is the one to act on)
A gold dot means the extreme is rolling over — the wave hit overbought/oversold and started turning back. When the gold dots fire, act: take profit, scale out, or tighten your stop. Don't wait for the wave to travel all the way back to the middle.
The background tint = momentum side at a glance
Faint green background = momentum on the up side.
Faint red background = momentum on the down side.
▲▼ Zero-cross = momentum flip
When the wave crosses 0, momentum just changed sides — an early heads-up.
Reading OSOB across a full session — red tops, green bottoms, gold exit bells at every turn
How to USE it with GLS (step by step)
GLS (top chart) gets you in with a 🟢/🔴 light.
While you're in the trade, watch OSOB — white wave = hold, let it ride.
When the wave reaches the colored extreme and the 🟡 gold exit-bell dot fires → take first target / scale / tighten your stop.
Use the OSOB alerts to get pinged on your phone when the extreme rolls over.
⚠️
Honest rule (read this twice)Overbought/oversold works in ranges and fails in strong trends — in a rip, the wave can pin at the top while price keeps running. So use OSOB for EXITS and scaling ONLY — never to enter, and never to fade a trend. That's exactly why it's the exit partner to GLS, not a second entry signal.
09
The Playbook (step-by-step trade)
Read DIRECTION. Which way is the market leaning? Only trade with it.
Wait for the BANNER to say SYSTEM GO — not just three lights, not a yellow candle.
Take the entry GLS draws — enter at the marked level, place your stop and target exactly where the ticket shows, size to your $ risk.
Move to breakeven at +1R. Now the trade can't hurt you.
Let the trail ride the trend toward the target (the banner will say RUNNER — LET IT RIDE).
Use OSOB to exit — when the 🟡 gold exit-bell dots fire, take first target / scale / tighten.
Stop for the day at your profit goal or loss limit. The firewall enforces it.
10
Risk & The Firewall
🛡 Rules the firewall enforces
Auto position sizing — GLS sizes the trade to your chosen $ risk. Never oversize.
ATR stop + reward target — every trade has a defined stop and target. No "hope."
Trailing stop — ride winners; breakeven at +1R protects you.
Daily Firewall — set a daily loss limit and a profit goal. Hit either → GLS says STAND DOWN / DONE — and you stop. This keeps funded accounts alive.
News blackout — GLS blocks the 8:30 & 10:00 ET news windows by default.
🛡
The most important feature in the whole toolOne disciplined "done for the day" saves more accounts than any signal.
11
When NOT to Trade
❌ CHOP — banner says "STAND ASIDE." No clean trend = no trade.
❌ Against the trend — a counter-trend yellow flip or bounce is a fake-out, not an entry.
❌ Into a reversal zone / resistance with the trend exhausted — that's an exit spot, not an entry.
❌ During news — let the 8:30 / 10:00 ET releases settle.
❌ After you hit your daily limit or goal — you're done. Walk away.
🧠
The best traders skip more than they takeGLS is built to keep you out of bad trades as much as to get you into good ones.
12
Best Times & Markets
Markets: MES (S&P), MNQ (Nasdaq), MGC (gold), MYM (Dow).
Sessions: trade the opens — London (~3:00 AM ET) and the New York open (index 9:30 ET, gold ~8:20 ET). GLS auto-fits the right session per instrument.
Avoid: the dead midday chop and the final minutes — let the system stay quiet there.
Timeframes: 5-minute to trade, 15-minute for context.
13
Common Mistakes (don't do these)
Buying the yellow candle. Yellow = warning, not buy. Wait for green + GO.
Trading against the DIR lean. If it's leaning short, you're looking for shorts.
Entering into a reversal zone with the trend. That's where you take profit, not where you enter.
Ignoring the banner. Three lights ≠ go. The banner is the final word.
Skipping the stop or oversizing. Always use the ticket's stop and size.
Trading after STAND DOWN. Done means done.
14
Power Features (optional — turn on when you're ready)
Everything above is all you need to trade. These extras are OFF by default on purpose — so the chart stays clean for new traders. Once the core feels second-nature, you can switch any of these ON in Settings. Add them one at a time so you understand each.
Beginner tip: ignore this whole page for your first couple weeks. Master direction → green light → manage → exit first. Come back here when you want more tools.
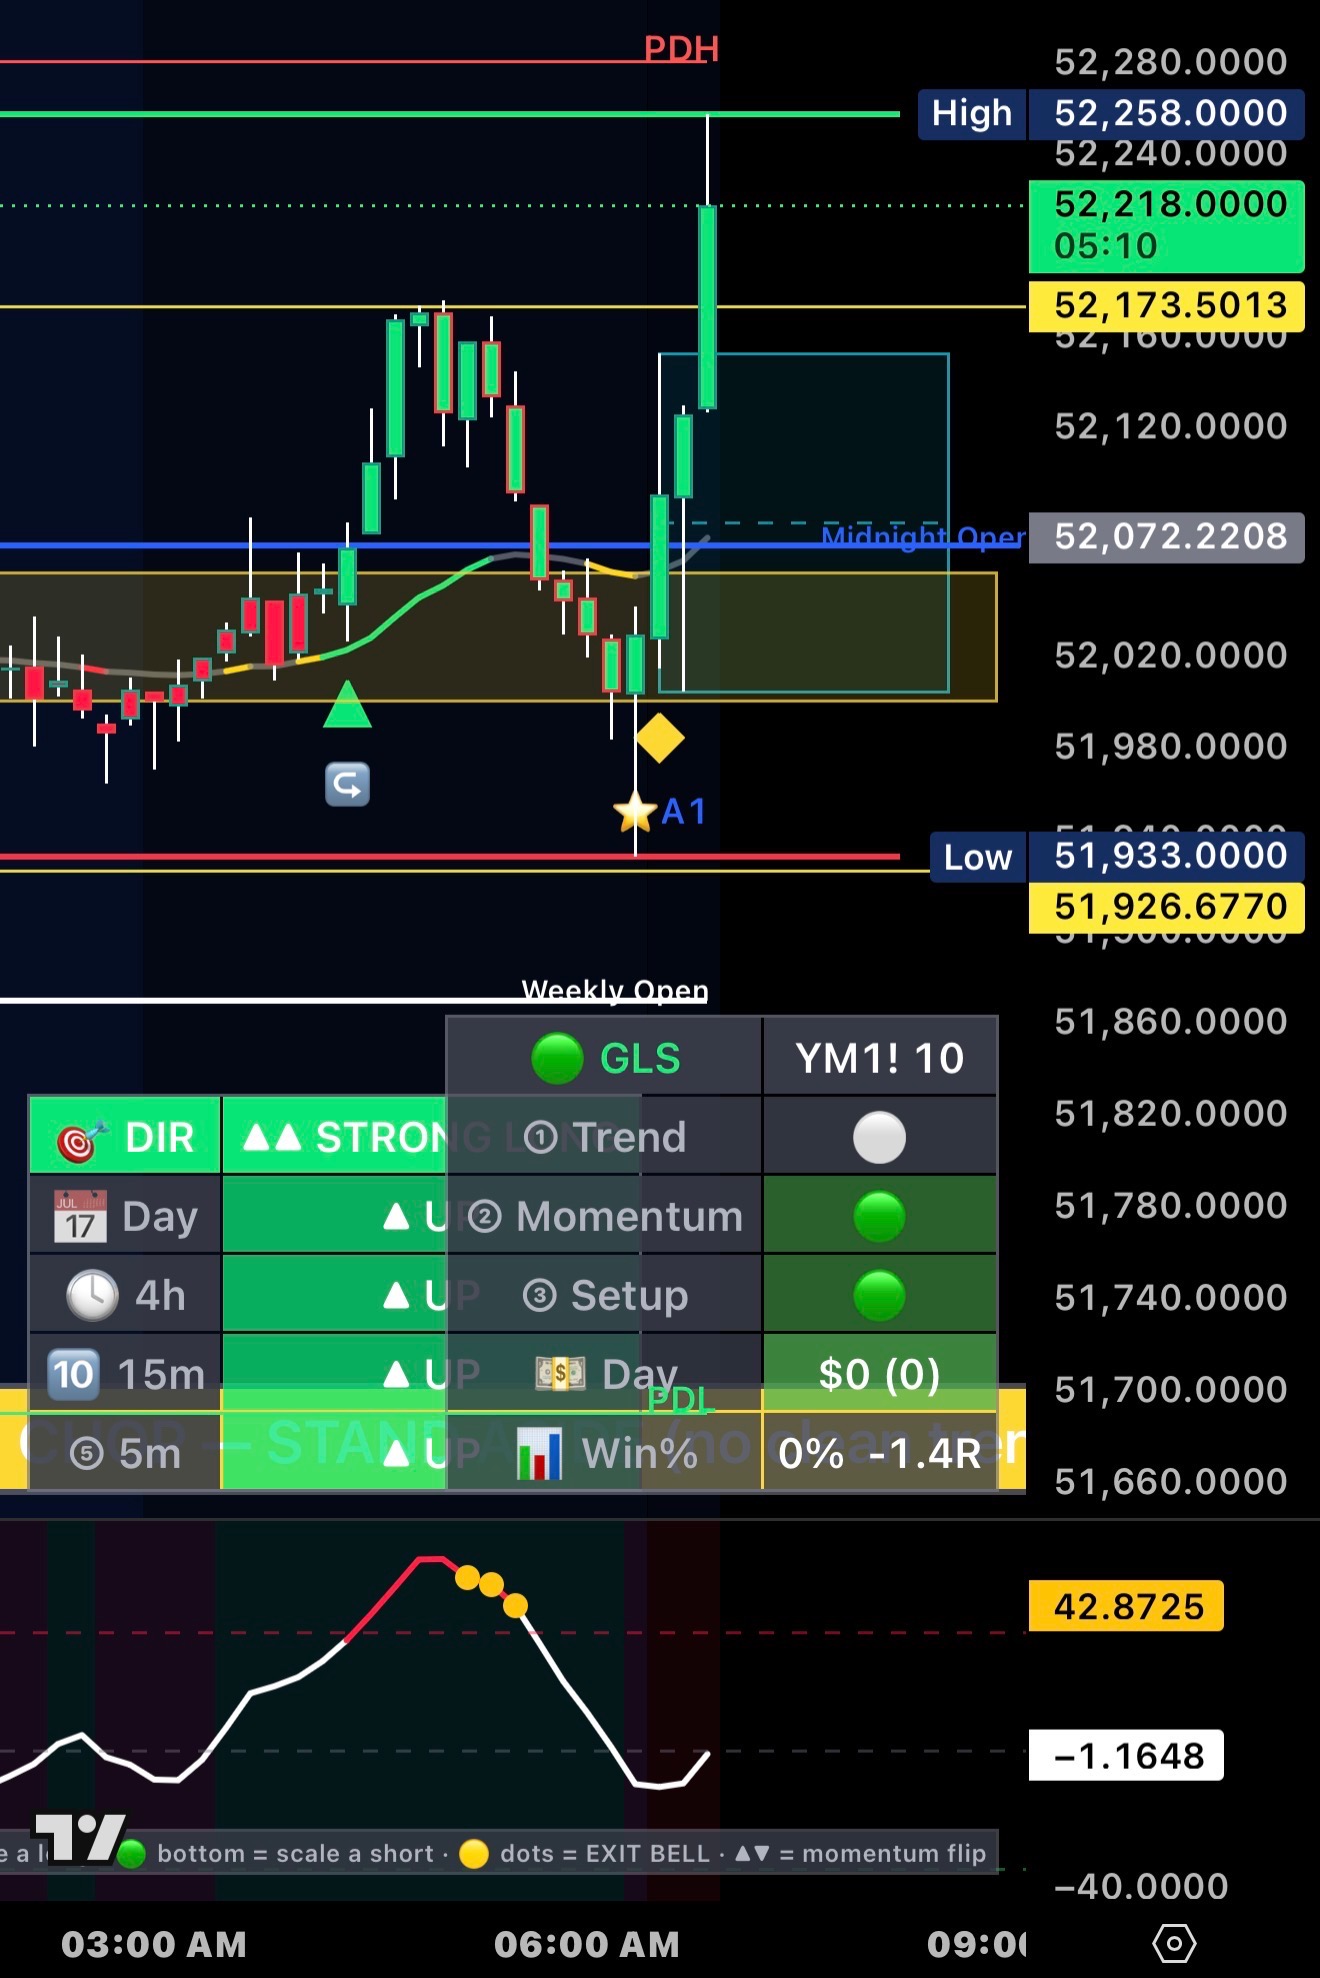
Power features on a Dow chart: PDH/PDL + Midnight Open + Weekly Open levels, the ⭐A1 setup, and a STRONG LONG read
🏛 BOS / CHoCH (structure breaks) — marks when price breaks a prior swing. BOS = the trend is continuing; CHoCH = the trend may be changing. A clean way to see structure shift. (Settings → Levels)
↪ Pullback entries — flags a dip back to the trend line that resumes with the trend (the bread-and-butter "buy the dip in an uptrend" spot). (Settings → Setup)
📐 Premium / Discount zones — shades the chart into "expensive" (premium, favor sells) and "cheap" (discount, favor buys) halves, so you buy low and sell high. (Settings → Display)
💧 Liquidity lines (PDH/PDL · PWH/PWL) — draws the prior day's and prior week's highs and lows. These are where stops sit and where price gets pulled — strong magnets and reaction levels. (Settings → Levels)
🟡✅ HTF-confirmed Yellow Man — a stronger version of the flip warning: it only marks 🟡✅ when the higher timeframes agree with the turn. More reliable heads-up. (on with Yellow Man)
🛡🧱 Strong Support / Resistance — green support / red resistance at levels tested 2+ times (the bounce and rejection spots). Master switch is OFF by default; flip it ON to show them. (Settings → Levels)
🕓 4h & 15m High/Low lines — key higher-timeframe levels drawn on your lower-timeframe chart for context. (Settings → Display)
🌙 Swing mode — switches the whole engine to 4h/Daily and ignores intraday sessions, for swing trading instead of day trading. (Settings → Sessions)
🕒 Power Hour — marks the 3–4 PM ET window. (Off by default — research shows a weak edge, so test it before trusting it.) (Settings → Sessions)
🔴 News-day stand-down — flip this ON before a big news day (CPI, FOMC) and GLS stays quiet all day so you don't get chopped up. (Settings → Firewall)
🔶 Level Regain — the failed-break reclaim: price pokes beyond a level then closes back within in 1–3 candles = a trap. Fires WITH the trend only. (Settings → Setup)
🔁 Reversal Switch — catches the flip after the Yellow Man warning; great for the slow overnight / Asia trends. Optional volume-spike setting for sharp-only reversals. (Settings → Setup)
🎯 Sniper — opening-momentum breakout dots (BUY / SELL / STRONG) for the first move of the session. (Settings → Setup)
🔔 Opening Go — the opening-bell direction call. Prints 🔔 OPENING GO – LONG or SHORT the moment the session opens clean, or 🟡 CHOP – STAND ASIDE when there's no clean trend — so you know your bias before the first candle. (Settings → Setup)
🔄 Smart Reversal — flags exhaustion at key levels — use it for exits and careful counter-trend, never a blind fade. (Settings → Setup)
⚡
Bonus Feature — Breakaway ScalperA separate range-break engine that trades the retest for you. When a range forms (yellow range lines), it waits for the break, drops a limit at the retest, then sets TP + SL at 1:1. It slides your stop to breakeven at +1R, and if the break rips away with no retest it still takes it at market (runner-catch). A strong-trend gate keeps it honest, and it works on any timeframe. Off by default — flip on useBreak when you want to scalp breakouts. (Settings → Setup)
Breakaway Scalper: range → break → limit at the retest → TP at 1:1, stop to breakeven.
🧩
The pointThe core keeps you simple and safe. These let an experienced trader go deeper without cluttering a beginner's chart. Turn on only what you'll actually use.
15
More Real Examples
A few more shots of the system on live charts so you know what to look for.
The full dashboard on a desktop chart — direction stack, the 3 lights, the banner, the zones all working together:
GLS desktop layout — dashboard, painted candles, golden pocket, VWAP, all in one view
Zones doing their job — golden pocket, reversal zones, and support/resistance marking the spots that matter:
Zones on the chart — golden pocket, reversal zones, support and resistance levels
Reading a move on gold (MGC) — trend, the band, VWAP, and the OSOB exit pane below:
Gold (MGC) with the trend EMAs, VWAP, and the OSOB exit pane
Study these until reading the chart at a glance feels natural. The more reps, the faster you'll spot a clean setup.
🟢 Final Word
Final Word
Green Light Special keeps you on the right side of the trend, out of the chop, and inside your risk. That's the whole game. Be patient, wait for the green light, take the trade it draws, manage it, and protect your daily number.
🟢 Get Access Today
When it's green, you go.
You've seen the whole system. Get it on your charts — both indicators plus the live signal group calling clean setups with you, all in one membership.
Green Light Special and GLS OSOB are educational tools, not financial advice and not a signal-for-hire service. No indicator predicts the market or guarantees profits — the real edge is filtering, risk/reward, and discipline. Trading futures involves substantial risk of loss. Always backtest and forward-test on your own instruments, trade small, and manage your risk. Past performance does not guarantee future results.